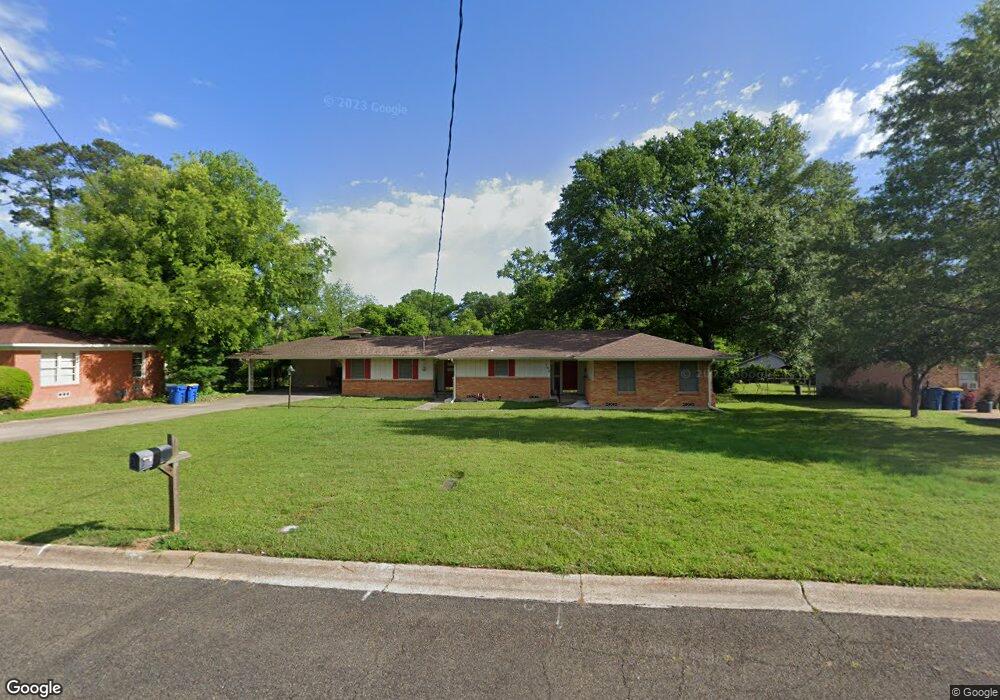
403 Turner St Kilgore, TX 75662
Estimated Value: $177,109 - $219,000
--
Bed
--
Bath
1,930
Sq Ft
$99/Sq Ft
Est. Value
About This Home
This home is located at 403 Turner St, Kilgore, TX 75662 and is currently estimated at $191,777, approximately $99 per square foot. 403 Turner St is a home located in Rusk County with nearby schools including Kilgore Primary School, Chandler Elementary School, and Kilgore Intermediate School.
Ownership History
Date
Name
Owned For
Owner Type
Purchase Details
Closed on
Jul 15, 2013
Sold by
Bolt Doris Busby
Bought by
Daniels Willie L and Daniels Kimberly M
Current Estimated Value
Home Financials for this Owner
Home Financials are based on the most recent Mortgage that was taken out on this home.
Original Mortgage
$115,764
Outstanding Balance
$83,100
Interest Rate
3.62%
Mortgage Type
FHA
Estimated Equity
$108,677
Purchase Details
Closed on
Nov 5, 2010
Sold by
Scrogum Donna Kay
Bought by
Gaines Donna Kay Scrogum
Create a Home Valuation Report for This Property
The Home Valuation Report is an in-depth analysis detailing your home's value as well as a comparison with similar homes in the area
Home Values in the Area
Average Home Value in this Area
Purchase History
| Date | Buyer | Sale Price | Title Company |
|---|---|---|---|
| Daniels Willie L | -- | None Available | |
| Gaines Donna Kay Scrogum | -- | None Available |
Source: Public Records
Mortgage History
| Date | Status | Borrower | Loan Amount |
|---|---|---|---|
| Open | Daniels Willie L | $115,764 |
Source: Public Records
Tax History Compared to Growth
Tax History
| Year | Tax Paid | Tax Assessment Tax Assessment Total Assessment is a certain percentage of the fair market value that is determined by local assessors to be the total taxable value of land and additions on the property. | Land | Improvement |
|---|---|---|---|---|
| 2024 | $3,068 | $150,970 | $25,000 | $125,970 |
| 2023 | $2,747 | $130,640 | $20,000 | $110,640 |
| 2022 | $2,762 | $108,330 | $8,000 | $100,330 |
| 2021 | $2,344 | $92,290 | $8,000 | $84,290 |
| 2020 | $2,345 | $92,290 | $8,000 | $84,290 |
| 2019 | $2,404 | $92,290 | $8,000 | $84,290 |
| 2018 | $2,460 | $92,290 | $8,000 | $84,290 |
| 2017 | $2,376 | $92,290 | $8,000 | $84,290 |
| 2016 | $2,376 | $92,290 | $8,000 | $84,290 |
| 2015 | -- | $92,290 | $8,000 | $84,290 |
| 2014 | -- | $97,330 | $8,000 | $89,330 |
Source: Public Records
Map
Nearby Homes