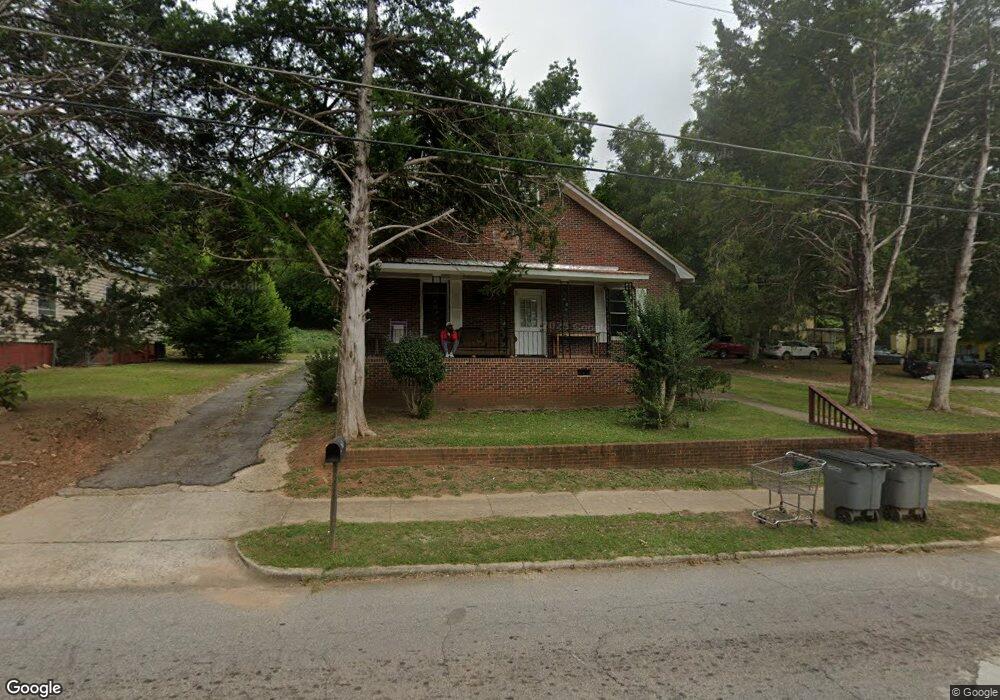
403 Union St Lagrange, GA 30241
Estimated Value: $80,000 - $161,000
4
Beds
2
Baths
1,528
Sq Ft
$73/Sq Ft
Est. Value
About This Home
This home is located at 403 Union St, Lagrange, GA 30241 and is currently estimated at $111,627, approximately $73 per square foot. 403 Union St is a home with nearby schools including Hollis Hand Elementary School, Franklin Forest Elementary School, and Ethel W. Kight Elementary School.
Ownership History
Date
Name
Owned For
Owner Type
Purchase Details
Closed on
Jan 22, 2002
Sold by
Otis E Stribling
Bought by
Riley Maxwell
Current Estimated Value
Purchase Details
Closed on
Jan 16, 2001
Sold by
Maxwell Riley
Bought by
Otis E Stribling
Purchase Details
Closed on
Oct 9, 2000
Sold by
Stribling Otis E
Bought by
Maxwell Riley
Purchase Details
Closed on
Aug 17, 2000
Sold by
Riley M
Bought by
Stribling Otis E
Purchase Details
Closed on
Oct 9, 1997
Sold by
Lizzie Culberson
Bought by
Riley M
Purchase Details
Closed on
Sep 5, 1997
Sold by
Buford Jennings
Bought by
Lizzie Culberson
Purchase Details
Closed on
Aug 18, 1997
Sold by
Shirley Brown Cox
Bought by
Buford Jennings
Purchase Details
Closed on
Aug 14, 1997
Sold by
Buford Jennings By Adm Of Est
Bought by
Shirley Brown Cox
Purchase Details
Closed on
Jan 16, 1996
Sold by
Ladye Jennings By Ex
Bought by
Buford Jennings By Adm Of Est
Purchase Details
Closed on
Oct 1, 1953
Sold by
Williams Minnie Davis
Bought by
Ladye Jennings By Ex
Create a Home Valuation Report for This Property
The Home Valuation Report is an in-depth analysis detailing your home's value as well as a comparison with similar homes in the area
Home Values in the Area
Average Home Value in this Area
Purchase History
| Date | Buyer | Sale Price | Title Company |
|---|---|---|---|
| Riley Maxwell | -- | -- | |
| Otis E Stribling | $12,000 | -- | |
| Maxwell Riley | $11,000 | -- | |
| Stribling Otis E | $9,000 | -- | |
| Riley M | $22,000 | -- | |
| Lizzie Culberson | -- | -- | |
| Buford Jennings | -- | -- | |
| Shirley Brown Cox | -- | -- | |
| Buford Jennings By Adm Of Est | -- | -- | |
| Ladye Jennings By Ex | -- | -- |
Source: Public Records
Tax History Compared to Growth
Tax History
| Year | Tax Paid | Tax Assessment Tax Assessment Total Assessment is a certain percentage of the fair market value that is determined by local assessors to be the total taxable value of land and additions on the property. | Land | Improvement |
|---|---|---|---|---|
| 2024 | $1,017 | $37,280 | $3,360 | $33,920 |
| 2023 | $782 | $28,680 | $3,360 | $25,320 |
| 2022 | $765 | $27,400 | $3,360 | $24,040 |
| 2021 | $729 | $24,160 | $3,360 | $20,800 |
| 2020 | $729 | $24,160 | $3,360 | $20,800 |
| 2019 | $689 | $22,840 | $3,360 | $19,480 |
| 2018 | $689 | $22,840 | $3,360 | $19,480 |
| 2017 | $682 | $22,604 | $3,124 | $19,480 |
| 2016 | $675 | $22,378 | $3,124 | $19,254 |
| 2015 | $678 | $22,453 | $3,199 | $19,254 |
| 2014 | $649 | $21,439 | $3,199 | $18,240 |
| 2013 | -- | $22,660 | $3,199 | $19,462 |
Source: Public Records
Map
Nearby Homes
- 105 Dix St
- 205 Fannin St
- 203 Fannin St
- 0 Locust St
- 0 Burr St
- 306 Burr St
- 910 N 916 1000 1002 N Oak & 1011 1019 1021 Johnson St
- 203 Revis St
- 205 Revis St
- 200 Mccall St
- 101 McGee St
- 303 E Mulberry St
- 803 1/2 Hines St
- 0 Brown St Unit 10550761
- 0 Brown St Unit 10550754
- 141 Main St
- 208 Render St
- 801 Hines St
- 311 Colquitt St
- 501 Milam St