Estimated Value: $463,000 - $600,000
3
Beds
2
Baths
2,079
Sq Ft
$261/Sq Ft
Est. Value
About This Home
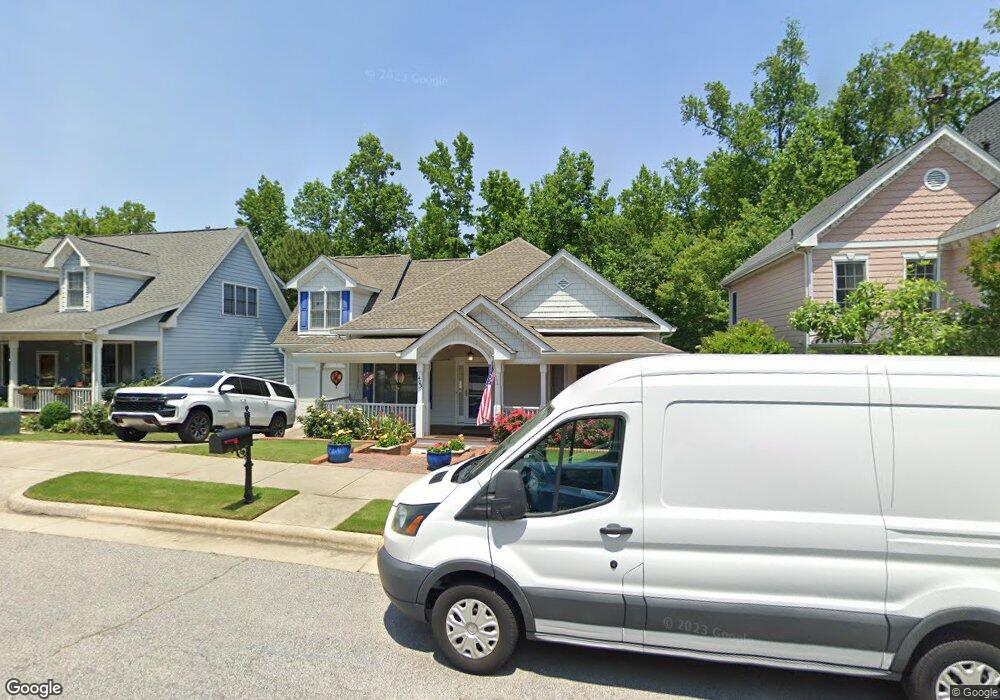
This home is located at 403 Village Loop Dr, Apex, NC 27502 and is currently estimated at $543,096, approximately $261 per square foot. 403 Village Loop Dr is a home located in Wake County with nearby schools including Scotts Ridge Elementary School, Apex Middle, and Apex High School.
Ownership History
Date
Name
Owned For
Owner Type
Purchase Details
Closed on
Oct 25, 2016
Sold by
Sleight Robert E
Bought by
Sleight Robert E and Robert E Sleight Revocable Living Trust
Current Estimated Value
Purchase Details
Closed on
Jan 18, 2005
Sold by
Courtemanche Kathleen
Bought by
Sleight Robert E
Home Financials for this Owner
Home Financials are based on the most recent Mortgage that was taken out on this home.
Original Mortgage
$150,000
Outstanding Balance
$75,532
Interest Rate
5.71%
Mortgage Type
Fannie Mae Freddie Mac
Estimated Equity
$467,564
Purchase Details
Closed on
Aug 29, 2002
Sold by
Biltmore Homes Llc
Bought by
Courtemanche Kathleen
Purchase Details
Closed on
Dec 17, 2001
Sold by
Scotts Woods Llc
Bought by
Biltmore Homes Llc
Create a Home Valuation Report for This Property
The Home Valuation Report is an in-depth analysis detailing your home's value as well as a comparison with similar homes in the area
Purchase History
| Date | Buyer | Sale Price | Title Company |
|---|---|---|---|
| Sleight Robert E | -- | None Available | |
| Sleight Robert E | $250,000 | -- | |
| Courtemanche Kathleen | $252,000 | -- | |
| Biltmore Homes Llc | $40,000 | -- |
Source: Public Records
Mortgage History
| Date | Status | Borrower | Loan Amount |
|---|---|---|---|
| Open | Sleight Robert E | $150,000 |
Source: Public Records
Tax History
| Year | Tax Paid | Tax Assessment Tax Assessment Total Assessment is a certain percentage of the fair market value that is determined by local assessors to be the total taxable value of land and additions on the property. | Land | Improvement |
|---|---|---|---|---|
| 2025 | $4,218 | $480,834 | $120,000 | $360,834 |
| 2024 | $4,124 | $480,834 | $120,000 | $360,834 |
Source: Public Records
Map
Nearby Homes
- 400 Village Loop Dr
- 517 Village Loop Dr
- 440 Oak Pine Dr
- 105 Garden Side Way
- 470 Magdala Place
- 107 Maple Crest Ct
- 0 Jb Morgan Rd Unit 10051948
- 1224 Tartarian Trail
- 1913 Metta Mill Ln
- 1818 Porch Swing Way
- 1006 Cherokee Sunset Rd
- 1216 Scotts Ridge Trail
- 1838 Woodall Crest Dr
- 1880 Woodall Crest Dr
- 1866 Porch Swing Way
- 1050 Scotts Ridge Trail
- 101 Rocklyn Ln
- 3021 White Cloud Cir
- 1047 Mica Lamp Ct
- 1314 Chenworth Dr
- 401 Village Loop Dr
- 405 Village Loop Dr
- 325 Village Loop Dr
- 407 Village Loop Dr
- 0 Village Loop Dr Unit 939829
- 0 Village Loop Dr Unit 919025
- 0 Village Loop Dr Unit 901899
- 0 Village Loop Dr Unit 1755296
- 0 Village Loop Dr Unit 1787066
- 0 Village Loop Dr Unit 1797952
- 0 Village Loop Dr Unit 939846
- 0 Village Loop Dr Unit 919020
- 0 Village Loop Dr Unit 1 TR1797952
- 0 Village Loop Dr Unit 1 1755296
- 0 Village Loop Dr Unit 1 1787066
- 0 Village Loop Dr Unit 1793238
- 402 Village Loop Dr
- 501 Village Loop Dr
- 404 Village Loop Dr
- 323 Village Loop Dr
Your Personal Tour Guide
Ask me questions while you tour the home.