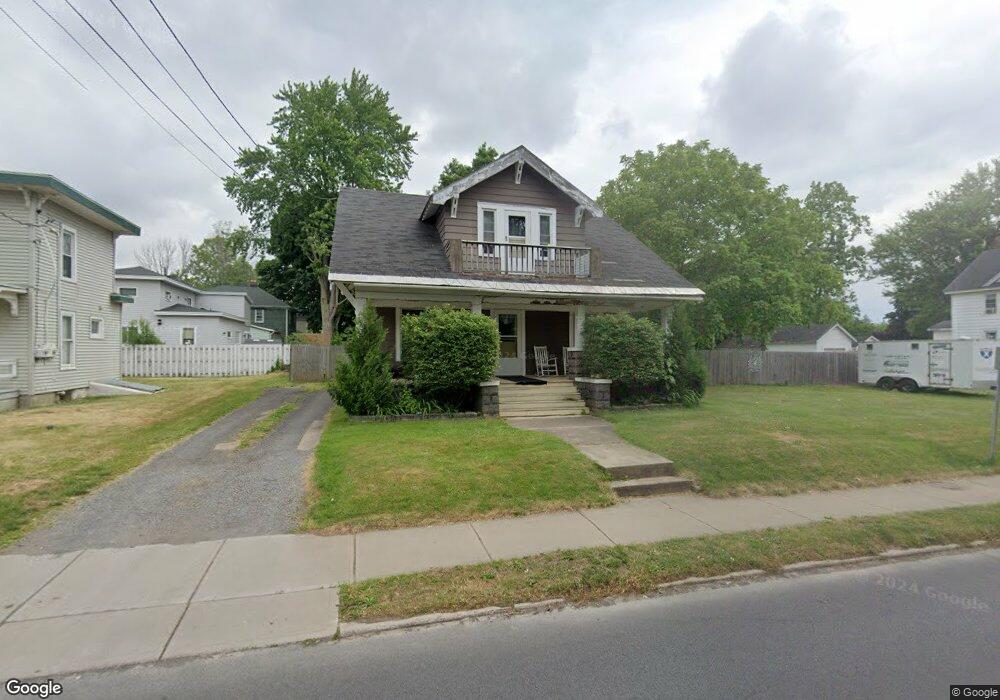
403 W 4th St S Fulton, NY 13069
Estimated Value: $113,000 - $149,000
4
Beds
2
Baths
1,650
Sq Ft
$78/Sq Ft
Est. Value
About This Home
This home is located at 403 W 4th St S, Fulton, NY 13069 and is currently estimated at $129,388, approximately $78 per square foot. 403 W 4th St S is a home located in Oswego County with nearby schools including G Ray Bodley High School.
Ownership History
Date
Name
Owned For
Owner Type
Purchase Details
Closed on
Nov 9, 2006
Sold by
Fulton Savings Bank
Bought by
Berry Saun
Current Estimated Value
Home Financials for this Owner
Home Financials are based on the most recent Mortgage that was taken out on this home.
Original Mortgage
$41,200
Outstanding Balance
$24,507
Interest Rate
6.31%
Mortgage Type
Purchase Money Mortgage
Estimated Equity
$104,881
Purchase Details
Closed on
Aug 24, 2006
Sold by
Switzer Caroline M
Bought by
Fulton Savings Bank
Purchase Details
Closed on
Jul 11, 2001
Sold by
Albrecht Leon
Bought by
Flynn Michael S
Create a Home Valuation Report for This Property
The Home Valuation Report is an in-depth analysis detailing your home's value as well as a comparison with similar homes in the area
Home Values in the Area
Average Home Value in this Area
Purchase History
| Date | Buyer | Sale Price | Title Company |
|---|---|---|---|
| Berry Saun | $42,500 | Ticor | |
| Fulton Savings Bank | $38,120 | None Available | |
| Flynn Michael S | $49,500 | Fred Sumner |
Source: Public Records
Mortgage History
| Date | Status | Borrower | Loan Amount |
|---|---|---|---|
| Open | Berry Saun | $41,200 |
Source: Public Records
Tax History Compared to Growth
Tax History
| Year | Tax Paid | Tax Assessment Tax Assessment Total Assessment is a certain percentage of the fair market value that is determined by local assessors to be the total taxable value of land and additions on the property. | Land | Improvement |
|---|---|---|---|---|
| 2024 | $4,882 | $70,200 | $6,300 | $63,900 |
| 2023 | $3,412 | $70,200 | $6,300 | $63,900 |
| 2022 | $3,054 | $70,200 | $6,300 | $63,900 |
| 2021 | $2,888 | $48,000 | $10,600 | $37,400 |
| 2020 | $2,048 | $48,000 | $10,600 | $37,400 |
| 2019 | $1,998 | $48,000 | $10,600 | $37,400 |
| 2018 | $1,998 | $48,000 | $10,600 | $37,400 |
| 2017 | $1,990 | $48,000 | $10,600 | $37,400 |
| 2016 | $2,004 | $48,000 | $10,600 | $37,400 |
| 2015 | -- | $48,000 | $10,600 | $37,400 |
| 2014 | -- | $48,000 | $10,600 | $37,400 |
Source: Public Records
Map
Nearby Homes