Estimated Value: $248,000 - $330,000
4
Beds
2
Baths
1,536
Sq Ft
$190/Sq Ft
Est. Value
About This Home
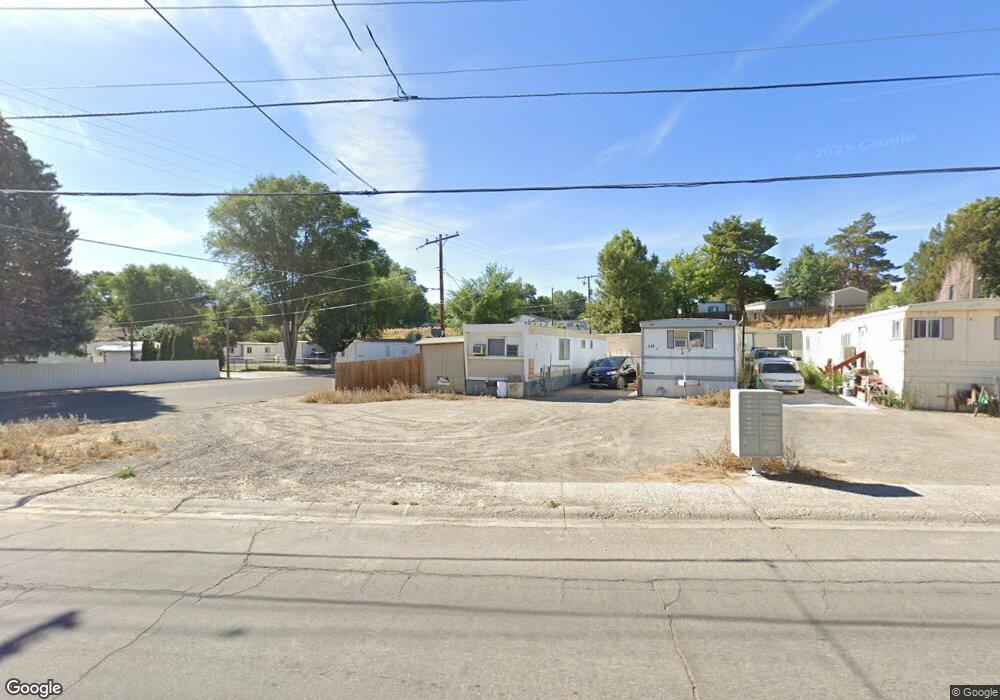
This home is located at 403 W Bullion Rd Unit 8, Elko, NV 89801 and is currently estimated at $291,229, approximately $189 per square foot. 403 W Bullion Rd Unit 8 is a home located in Elko County with nearby schools including Southside Elementary School, Flagview Intermediate School, and Adobe Middle School.
Ownership History
Date
Name
Owned For
Owner Type
Purchase Details
Closed on
May 10, 2022
Sold by
Sue Wise Laurie
Bought by
El Ausente Llc
Current Estimated Value
Home Financials for this Owner
Home Financials are based on the most recent Mortgage that was taken out on this home.
Original Mortgage
$214,200
Outstanding Balance
$203,522
Interest Rate
5.27%
Mortgage Type
New Conventional
Estimated Equity
$87,707
Purchase Details
Closed on
Mar 26, 2008
Sold by
Eldredge David C and Stevens Lawana
Bought by
Wise Laurie Sue
Home Financials for this Owner
Home Financials are based on the most recent Mortgage that was taken out on this home.
Original Mortgage
$98,000
Interest Rate
6.04%
Mortgage Type
Seller Take Back
Purchase Details
Closed on
Jan 24, 2008
Sold by
Wise Laurie Sue and Goldie Laurie S
Bought by
Goldie Ronald Allen
Create a Home Valuation Report for This Property
The Home Valuation Report is an in-depth analysis detailing your home's value as well as a comparison with similar homes in the area
Home Values in the Area
Average Home Value in this Area
Purchase History
| Date | Buyer | Sale Price | Title Company |
|---|---|---|---|
| El Ausente Llc | $180,000 | Wfg National Title | |
| Wise Laurie Sue | $98,000 | None Available | |
| Goldie Ronald Allen | -- | None Available |
Source: Public Records
Mortgage History
| Date | Status | Borrower | Loan Amount |
|---|---|---|---|
| Open | El Ausente Llc | $214,200 | |
| Previous Owner | Wise Laurie Sue | $98,000 |
Source: Public Records
Tax History Compared to Growth
Tax History
| Year | Tax Paid | Tax Assessment Tax Assessment Total Assessment is a certain percentage of the fair market value that is determined by local assessors to be the total taxable value of land and additions on the property. | Land | Improvement |
|---|---|---|---|---|
| 2025 | $2,007 | $72,818 | $2,060 | $70,758 |
| 2024 | $2,007 | $74,903 | $2,060 | $72,843 |
| 2023 | $1,806 | $45,718 | $2,060 | $43,658 |
| 2022 | $1,063 | $39,642 | $2,060 | $37,582 |
| 2021 | $1,118 | $39,093 | $2,060 | $37,033 |
| 2020 | $1,121 | $39,866 | $2,060 | $37,806 |
| 2019 | $1,088 | $38,529 | $2,060 | $36,469 |
| 2018 | $1,098 | $39,003 | $2,060 | $36,943 |
| 2017 | $993 | $38,724 | $2,060 | $36,664 |
| 2016 | $1,004 | $39,236 | $2,060 | $37,176 |
| 2015 | $1,005 | $39,227 | $2,060 | $37,167 |
| 2014 | $1,004 | $38,010 | $2,060 | $35,950 |
Source: Public Records
Map
Nearby Homes
- 2768 Bullion Rd
- 648 Bullion Rd
- 1075 Amber Way
- 1014 Amber Way
- 1259 Amber Way
- 0 Amber Way
- 1674 Hamilton Creek Trail
- 615 Mahogany Ln
- 386 W Fir St
- 0 Hamilton Creek Trail
- 350 W Fir St
- 133 W River St
- 240 S 1st St
- 288 W Fir St
- 209 W Fir St
- 775 1st St
- 7270 Adams St
- 2375 Hamilton Creek Trail
- 0 2nd St
- 1265 Dotta Dr
- 2550 Bullion Rd
- 1617 Bullion Rd
- 1399 Bullion Rd
- TBD Bullion Rd
- 2955 Bullion Rd
- 3155 Bullion Rd
- 509 Hot Springs Rd
- 3521 Bullion Rd
- 3731 Hamilton Stage Rd
- 3525 Bullion Rd
- 693 Bellinger Dr
- 698 Bullion Rd
- 3750 Bullion Rd
- 3650 Humbolt Ln
- 651 Bullion Rd Unit 3
- 3925 Hamilton Stage Rd
- 674 Bullion Rd
- 668 Bullion Rd
- 4010 Bullion Rd
- 254 Sherlock Rd