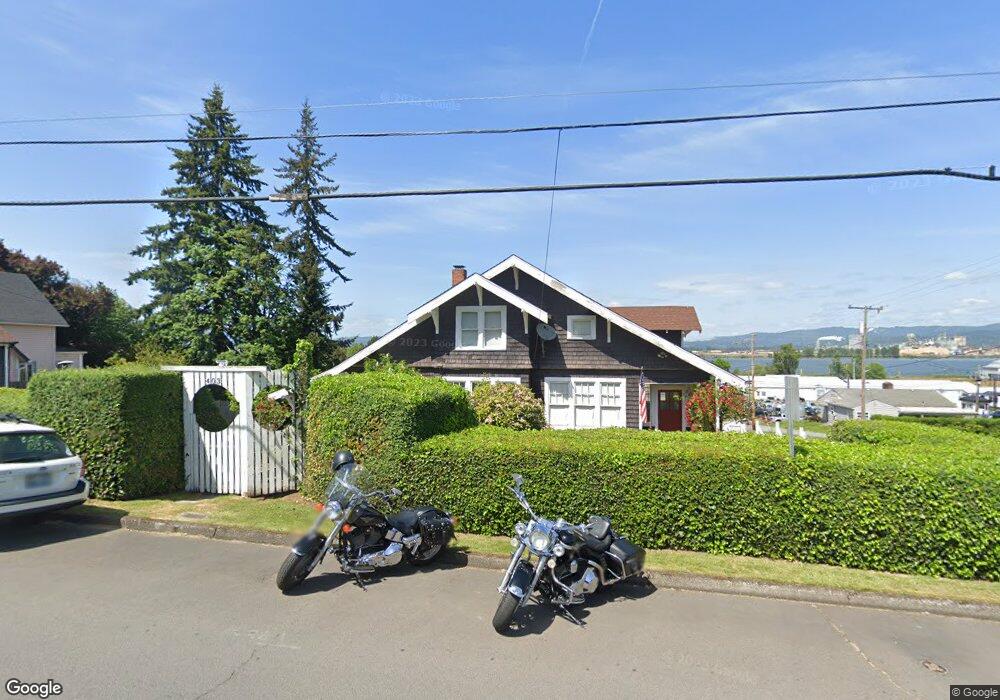
403 W C St Rainier, OR 97048
Estimated Value: $356,524 - $413,000
4
Beds
1
Bath
1,438
Sq Ft
$268/Sq Ft
Est. Value
About This Home
This home is located at 403 W C St, Rainier, OR 97048 and is currently estimated at $385,381, approximately $267 per square foot. 403 W C St is a home with nearby schools including Hudson Park Elementary School, Rainier Junior/Senior High School, and North Columbia Academy.
Ownership History
Date
Name
Owned For
Owner Type
Purchase Details
Closed on
Sep 20, 2004
Sold by
Daily Bruce P and Daily Sylvia L
Bought by
Frint Dana R
Current Estimated Value
Home Financials for this Owner
Home Financials are based on the most recent Mortgage that was taken out on this home.
Original Mortgage
$102,000
Outstanding Balance
$50,379
Interest Rate
5.94%
Mortgage Type
Commercial
Estimated Equity
$335,002
Create a Home Valuation Report for This Property
The Home Valuation Report is an in-depth analysis detailing your home's value as well as a comparison with similar homes in the area
Home Values in the Area
Average Home Value in this Area
Purchase History
| Date | Buyer | Sale Price | Title Company |
|---|---|---|---|
| Frint Dana R | $127,500 | Ticor Title |
Source: Public Records
Mortgage History
| Date | Status | Borrower | Loan Amount |
|---|---|---|---|
| Open | Frint Dana R | $102,000 |
Source: Public Records
Tax History Compared to Growth
Tax History
| Year | Tax Paid | Tax Assessment Tax Assessment Total Assessment is a certain percentage of the fair market value that is determined by local assessors to be the total taxable value of land and additions on the property. | Land | Improvement |
|---|---|---|---|---|
| 2025 | $2,096 | $113,490 | $50,770 | $62,720 |
| 2024 | $2,047 | $110,190 | $49,290 | $60,900 |
| 2023 | $2,019 | $106,990 | $47,050 | $59,940 |
| 2022 | $1,928 | $103,880 | $45,680 | $58,200 |
| 2021 | $1,897 | $100,860 | $31,060 | $69,800 |
| 2020 | $1,843 | $97,930 | $35,360 | $62,570 |
| 2019 | $1,814 | $95,080 | $25,650 | $69,430 |
| 2018 | $1,772 | $92,320 | $36,810 | $55,510 |
| 2017 | $1,756 | $89,640 | $35,740 | $53,900 |
| 2016 | $1,706 | $87,030 | $34,690 | $52,340 |
| 2015 | $1,646 | $84,500 | $31,960 | $52,540 |
| 2014 | $1,597 | $82,040 | $32,500 | $49,540 |
Source: Public Records
Map
Nearby Homes