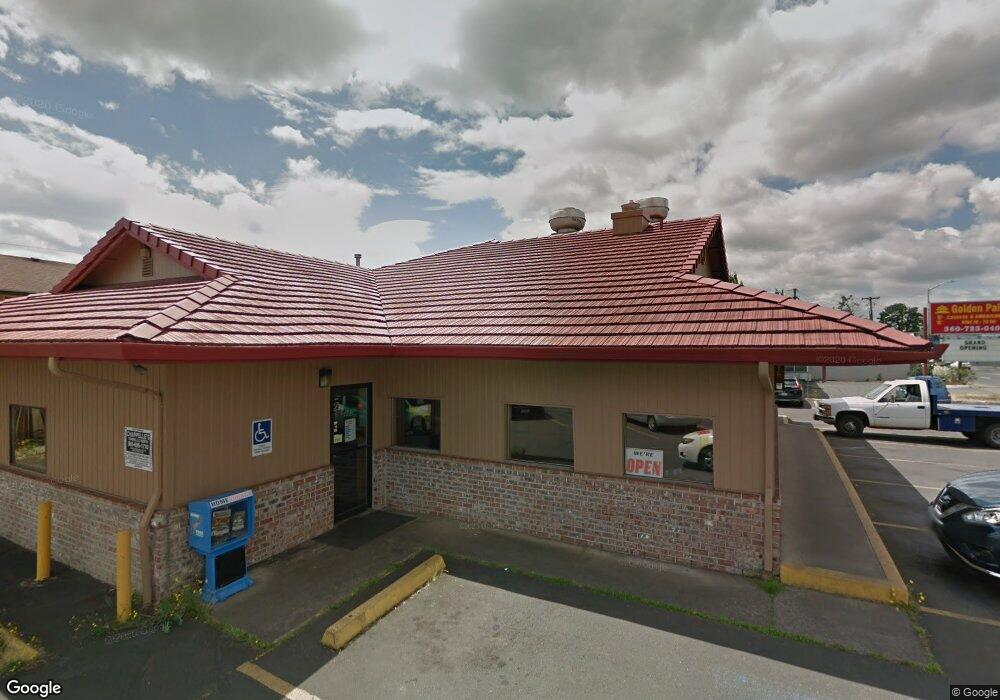
403 W Main St Battle Ground, WA 98604
Estimated Value: $1,056,106
--
Bed
--
Bath
2,732
Sq Ft
$387/Sq Ft
Est. Value
About This Home
This home is located at 403 W Main St, Battle Ground, WA 98604 and is currently priced at $1,056,106, approximately $386 per square foot. 403 W Main St is a home located in Clark County with nearby schools including Captain Strong Primary School, Chief Umtuch Middle School, and Battle Ground High School.
Ownership History
Date
Name
Owned For
Owner Type
Purchase Details
Closed on
Jul 14, 2017
Sold by
Landton Northwest Llc
Bought by
Sui Wah Chan Llc
Current Estimated Value
Home Financials for this Owner
Home Financials are based on the most recent Mortgage that was taken out on this home.
Original Mortgage
$538,700
Outstanding Balance
$448,183
Interest Rate
3.94%
Mortgage Type
Commercial
Purchase Details
Closed on
Apr 11, 2011
Sold by
Wan Alan
Bought by
Landton Northwest Llc
Purchase Details
Closed on
Jul 21, 2010
Sold by
The Estate Of Amanda Siu Hing Chow and Wan Alan
Bought by
Wan Alan
Home Financials for this Owner
Home Financials are based on the most recent Mortgage that was taken out on this home.
Original Mortgage
$40,542
Interest Rate
4.51%
Mortgage Type
Credit Line Revolving
Purchase Details
Closed on
Sep 7, 2001
Sold by
Chow Yuen Cheung and Chow Kwai Mui So
Bought by
Wan Alan Cheung Shing and Chow Amanda Siu Hing
Create a Home Valuation Report for This Property
The Home Valuation Report is an in-depth analysis detailing your home's value as well as a comparison with similar homes in the area
Home Values in the Area
Average Home Value in this Area
Purchase History
| Date | Buyer | Sale Price | Title Company |
|---|---|---|---|
| Sui Wah Chan Llc | $485,000 | Fidelity Title Dt Vancouver | |
| Landton Northwest Llc | -- | None Available | |
| Wan Alan | -- | None Available | |
| Wan Alan Cheung Shing | -- | Fidelity National Title Co |
Source: Public Records
Mortgage History
| Date | Status | Borrower | Loan Amount |
|---|---|---|---|
| Open | Sui Wah Chan Llc | $538,700 | |
| Previous Owner | Wan Alan | $40,542 |
Source: Public Records
Tax History Compared to Growth
Tax History
| Year | Tax Paid | Tax Assessment Tax Assessment Total Assessment is a certain percentage of the fair market value that is determined by local assessors to be the total taxable value of land and additions on the property. | Land | Improvement |
|---|---|---|---|---|
| 2025 | $4,773 | $585,600 | $355,400 | $230,200 |
| 2024 | $4,056 | $585,600 | $355,400 | $230,200 |
| 2023 | $4,045 | $514,700 | $293,260 | $221,440 |
| 2022 | $3,598 | $514,700 | $293,260 | $221,440 |
| 2021 | $4,613 | $397,715 | $266,600 | $131,115 |
| 2020 | $4,089 | $467,900 | $266,600 | $201,300 |
| 2019 | $3,494 | $469,900 | $279,930 | $189,970 |
| 2018 | $4,528 | $469,900 | $0 | $0 |
| 2017 | $4,158 | $447,500 | $0 | $0 |
| 2016 | $3,637 | $447,500 | $0 | $0 |
| 2015 | $3,832 | $359,100 | $0 | $0 |
| 2014 | -- | $359,100 | $0 | $0 |
| 2013 | -- | $359,100 | $0 | $0 |
Source: Public Records
Map
Nearby Homes
- 532 SW 23rd St
- 526 SW 23rd St
- 407 SW 32nd St
- 3309 SE 12th Ave
- 408 S Parkway Ave
- 213 SE 1st Ave
- 300 SW 7th Ave Unit 704
- 300 SW 7th Ave Unit 905
- 300 SW 7th Ave Unit 211
- 300 SW 7th Ave Unit 302
- 300 SW 7th Ave Unit 127
- 300 SW 7th Ave Unit 102
- 300 SW 7th Ave Unit 1202
- 637 31st St
- 805 32nd St
- 893 31st St
- 838 32nd St
- 709 NW 6th Ave
- 301 SW 8th St
- 12 SE 9th Cir