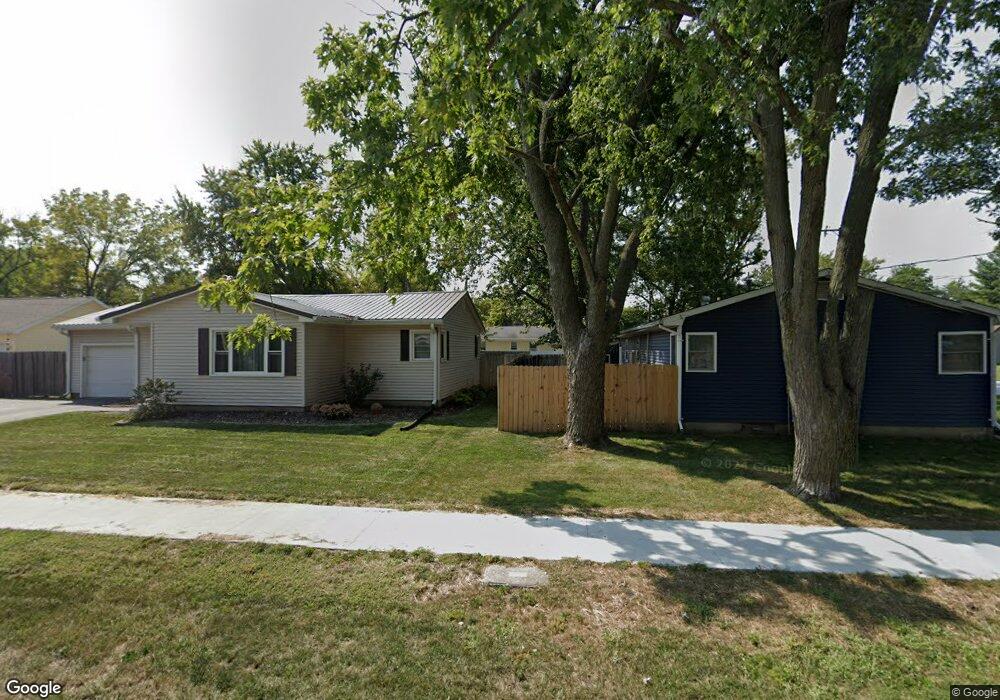
403 W Milton St Sullivan, IL 61951
Estimated Value: $109,307 - $127,000
3
Beds
1
Bath
1,056
Sq Ft
$112/Sq Ft
Est. Value
About This Home
This home is located at 403 W Milton St, Sullivan, IL 61951 and is currently estimated at $118,327, approximately $112 per square foot. 403 W Milton St is a home located in Moultrie County with nearby schools including Sullivan Elementary School, Sullivan Middle School, and Sullivan High School.
Ownership History
Date
Name
Owned For
Owner Type
Purchase Details
Closed on
Jul 19, 2019
Sold by
Rawski Kenneth J
Bought by
Brown Breea
Current Estimated Value
Home Financials for this Owner
Home Financials are based on the most recent Mortgage that was taken out on this home.
Original Mortgage
$67,500
Outstanding Balance
$60,160
Interest Rate
4.7%
Mortgage Type
New Conventional
Estimated Equity
$58,167
Purchase Details
Closed on
May 11, 2012
Sold by
Brown Laura and Rawski Laura
Bought by
Rawski Kenneth J and Rawski Laura A
Create a Home Valuation Report for This Property
The Home Valuation Report is an in-depth analysis detailing your home's value as well as a comparison with similar homes in the area
Home Values in the Area
Average Home Value in this Area
Purchase History
| Date | Buyer | Sale Price | Title Company |
|---|---|---|---|
| Brown Breea | $75,000 | None Available | |
| Rawski Kenneth J | -- | None Available |
Source: Public Records
Mortgage History
| Date | Status | Borrower | Loan Amount |
|---|---|---|---|
| Open | Brown Breea | $67,500 |
Source: Public Records
Tax History
| Year | Tax Paid | Tax Assessment Tax Assessment Total Assessment is a certain percentage of the fair market value that is determined by local assessors to be the total taxable value of land and additions on the property. | Land | Improvement |
|---|---|---|---|---|
| 2024 | $1,948 | $27,052 | $2,085 | $24,967 |
| 2023 | $1,790 | $25,399 | $1,958 | $23,441 |
| 2022 | $1,857 | $26,165 | $5,228 | $20,937 |
| 2021 | $2,346 | $24,877 | $4,971 | $19,906 |
| 2020 | $2,259 | $23,888 | $4,773 | $19,115 |
| 2019 | $2,194 | $23,468 | $4,689 | $18,779 |
| 2018 | $1,825 | $19,461 | $2,533 | $16,928 |
| 2017 | $1,835 | $19,386 | $2,523 | $16,863 |
| 2016 | $1,923 | $19,429 | $2,529 | $16,900 |
| 2015 | $1,892 | $19,050 | $2,480 | $16,570 |
| 2014 | -- | $18,150 | $2,540 | $15,610 |
| 2013 | -- | $18,150 | $2,540 | $15,610 |
Source: Public Records
Map
Nearby Homes
- 520 N Camfield St
- 407 N Main St
- 114 N Fuller St
- 304 E Jackson St
- 21 Seth Dunscomb Dr
- 521 S Catalpa St
- 20 Pifers Ln
- 612 S Hope Ln
- 804 S Washington St
- 919 S Van Buren St
- 1023 S Washington St
- 17 Roley Estates
- 1650 & 1660 S Patterson Rd
- 1046 State 32 Hwy
- 974 Cr 1300e
- 122 South Shores
- 58 S Shores
- 1412 South Shores
- 1414 South Shores
- 670A County Road 1875 N
- 807 N Graham St
- 6 Parkway Dr
- 720 N Graham St
- 714 N Graham St
- 7 Parkway Dr
- 410 W Magill St
- 714 N Seymour St
- 804 N Seymour St
- 8 Parkway Dr
- 316 W Magill St
- 402 W Magill St
- 5 Parkway Dr
- 416 W Magill St
- 310 W Magill St
- 9 Parkway Dr
- 814 N Seymour St
- 819 N Graham St
- 15 Parkway Dr
- 721 N Seymour St
- 4 Parkway Dr
Your Personal Tour Guide
Ask me questions while you tour the home.