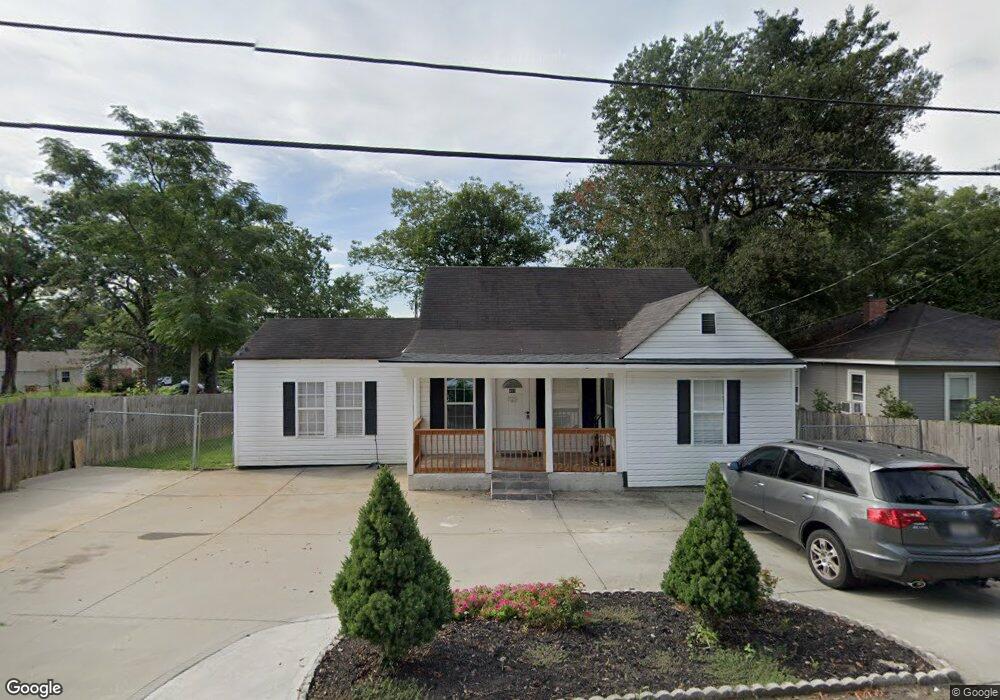
403 W Morgan St Greenville, SC 29611
City View NeighborhoodEstimated Value: $172,000 - $224,555
3
Beds
2
Baths
1,151
Sq Ft
$171/Sq Ft
Est. Value
About This Home
This home is located at 403 W Morgan St, Greenville, SC 29611 and is currently estimated at $196,389, approximately $170 per square foot. 403 W Morgan St is a home located in Greenville County with nearby schools including Alexander Elementary School, Lakeview Middle, and Greenville Senior High School.
Ownership History
Date
Name
Owned For
Owner Type
Purchase Details
Closed on
Jan 9, 2020
Sold by
Bryant Roy E
Bought by
Reyes Jose Fermin and Coj Eva Cux
Current Estimated Value
Purchase Details
Closed on
Apr 16, 2013
Sold by
Scopa Ralph E
Bought by
Coj Eva Cux
Purchase Details
Closed on
Nov 27, 2012
Sold by
Achi Investments Llc
Bought by
Scopa Ralph E
Purchase Details
Closed on
Nov 28, 2006
Sold by
Vaughn R Allen
Bought by
Phoenician Family Lp
Create a Home Valuation Report for This Property
The Home Valuation Report is an in-depth analysis detailing your home's value as well as a comparison with similar homes in the area
Home Values in the Area
Average Home Value in this Area
Purchase History
| Date | Buyer | Sale Price | Title Company |
|---|---|---|---|
| Reyes Jose Fermin | $21,000 | None Available | |
| Coj Eva Cux | $22,500 | -- | |
| Scopa Ralph E | $15,500 | -- | |
| Phoenician Family Lp | $95,920 | None Available |
Source: Public Records
Tax History Compared to Growth
Tax History
| Year | Tax Paid | Tax Assessment Tax Assessment Total Assessment is a certain percentage of the fair market value that is determined by local assessors to be the total taxable value of land and additions on the property. | Land | Improvement |
|---|---|---|---|---|
| 2024 | $2,542 | $5,820 | $1,350 | $4,470 |
| 2023 | $2,542 | $5,820 | $1,350 | $4,470 |
| 2022 | $2,454 | $5,820 | $1,350 | $4,470 |
| 2021 | $2,548 | $5,820 | $1,350 | $4,470 |
| 2020 | $2,375 | $5,070 | $600 | $4,470 |
| 2019 | $1,516 | $2,960 | $360 | $2,600 |
| 2018 | $1,391 | $2,960 | $360 | $2,600 |
| 2017 | $1,375 | $2,960 | $360 | $2,600 |
| 2016 | $1,319 | $49,340 | $6,000 | $43,340 |
| 2015 | $1,319 | $49,340 | $6,000 | $43,340 |
| 2014 | $1,202 | $44,450 | $8,367 | $36,083 |
Source: Public Records
Map
Nearby Homes