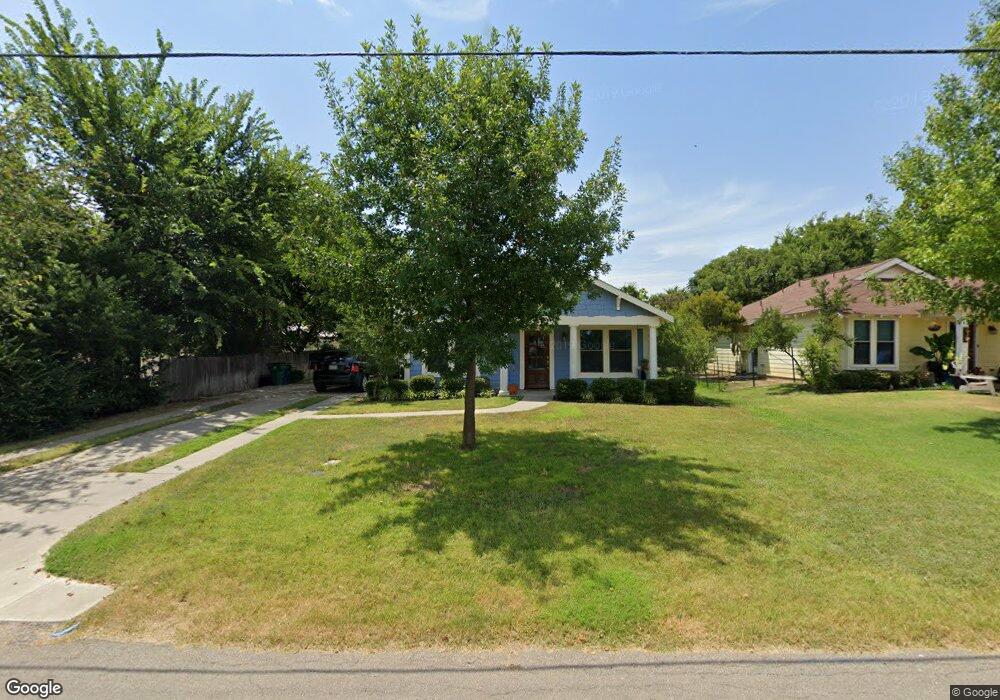
403 W Oak St Decatur, TX 76234
Estimated Value: $225,499 - $265,000
3
Beds
2
Baths
1,140
Sq Ft
$210/Sq Ft
Est. Value
About This Home
This home is located at 403 W Oak St, Decatur, TX 76234 and is currently estimated at $239,375, approximately $209 per square foot. 403 W Oak St is a home located in Wise County with nearby schools including Decatur High School and Victory Christian Academy.
Ownership History
Date
Name
Owned For
Owner Type
Purchase Details
Closed on
Jun 26, 2014
Sold by
Spence Clifford J
Bought by
Wells Frank and Wells Cathy
Current Estimated Value
Home Financials for this Owner
Home Financials are based on the most recent Mortgage that was taken out on this home.
Original Mortgage
$68,800
Outstanding Balance
$52,542
Interest Rate
4.23%
Mortgage Type
New Conventional
Estimated Equity
$186,833
Purchase Details
Closed on
Feb 28, 2014
Sold by
Spence Kathleen L
Bought by
Spence Clifford J
Purchase Details
Closed on
Jan 6, 2006
Sold by
Ktnt Properties Llc
Bought by
Spence Clifford Joe
Create a Home Valuation Report for This Property
The Home Valuation Report is an in-depth analysis detailing your home's value as well as a comparison with similar homes in the area
Home Values in the Area
Average Home Value in this Area
Purchase History
| Date | Buyer | Sale Price | Title Company |
|---|---|---|---|
| Wells Frank | -- | None Available | |
| Spence Clifford J | -- | None Available | |
| Spence Clifford Joe | -- | Wise County Title Co |
Source: Public Records
Mortgage History
| Date | Status | Borrower | Loan Amount |
|---|---|---|---|
| Open | Wells Frank | $68,800 |
Source: Public Records
Tax History Compared to Growth
Tax History
| Year | Tax Paid | Tax Assessment Tax Assessment Total Assessment is a certain percentage of the fair market value that is determined by local assessors to be the total taxable value of land and additions on the property. | Land | Improvement |
|---|---|---|---|---|
| 2025 | $3,282 | $193,517 | $51,981 | $141,536 |
| 2024 | $3,282 | $180,297 | $35,808 | $144,489 |
| 2023 | $3,374 | $186,019 | $35,808 | $150,211 |
| 2022 | $3,448 | $157,456 | $23,872 | $133,584 |
| 2021 | $3,069 | $134,470 | $23,870 | $110,600 |
| 2020 | $2,929 | $124,880 | $22,380 | $102,500 |
| 2019 | $2,992 | $120,730 | $22,380 | $98,350 |
| 2018 | $2,775 | $107,330 | $8,950 | $98,380 |
| 2017 | $2,592 | $99,870 | $8,950 | $90,920 |
| 2016 | $2,393 | $92,180 | $8,950 | $83,230 |
| 2015 | -- | $90,990 | $8,950 | $82,040 |
| 2014 | -- | $80,520 | $5,970 | $74,550 |
Source: Public Records
Map
Nearby Homes
- 407 N Lane St
- 1 S Martin Extension
- 401 S Holman St
- 601 W Brady St
- 606 W Mulberry St
- 700 N Church St
- 101 E Mulberry St
- 0 N Hwy 287 Unit 25379920
- 305 E Shoemaker St
- 304 Cyndilu Ln
- TBD Farm To Market 51
- 802 N Church St
- 204 W Collins St
- 602 N Cates St
- 903 N Miller St
- 709 S Church St
- 114 Sondra Lin Blvd
- 200 W Hale Ave
- 506 E Main St
- 805 Hollyn Dr