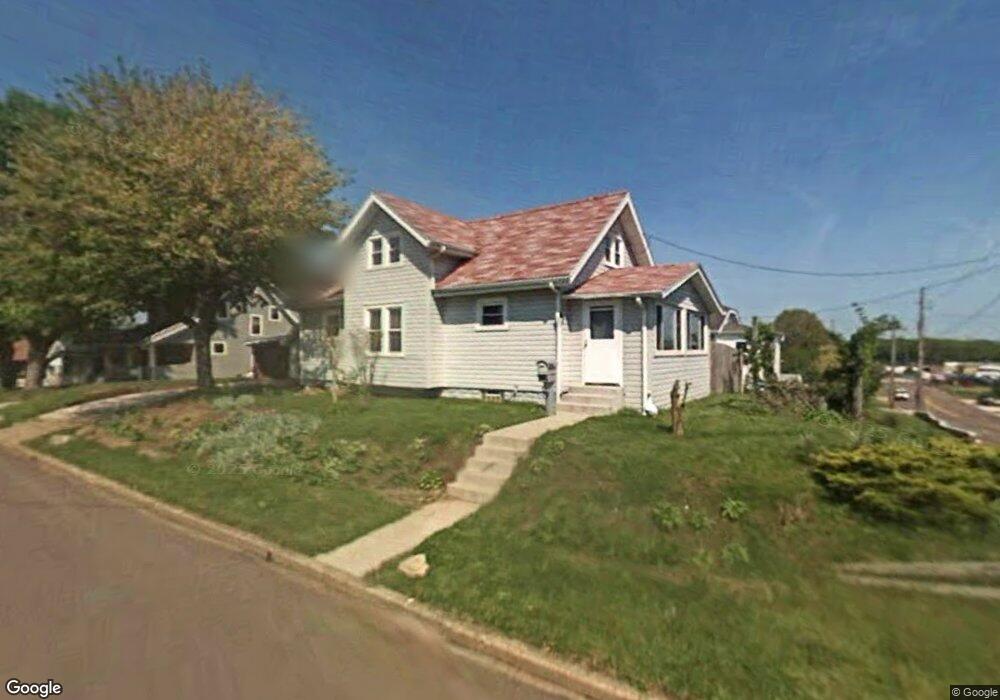
403 W Waterloo Rd Akron, OH 44314
Kenmore NeighborhoodEstimated Value: $116,005 - $135,000
3
Beds
1
Bath
680
Sq Ft
$181/Sq Ft
Est. Value
About This Home
This home is located at 403 W Waterloo Rd, Akron, OH 44314 and is currently estimated at $123,251, approximately $181 per square foot. 403 W Waterloo Rd is a home located in Summit County with nearby schools including Kenmore Garfield Community Learning Center, St. Francis de Sales School, and Sam Salem Community Learning Center.
Ownership History
Date
Name
Owned For
Owner Type
Purchase Details
Closed on
Oct 15, 2024
Sold by
Bussey Douglas A and Bussey Betty E
Bought by
Bussey Family Trust and Bussey
Current Estimated Value
Purchase Details
Closed on
Aug 9, 2003
Sold by
Spindler Betty E and Spindler Betty E
Bought by
Bussey Douglas A and Bussey Betty E
Home Financials for this Owner
Home Financials are based on the most recent Mortgage that was taken out on this home.
Original Mortgage
$54,000
Interest Rate
5.47%
Mortgage Type
Purchase Money Mortgage
Purchase Details
Closed on
May 28, 1997
Sold by
Hull Leo B
Bought by
Spindler Betty E
Home Financials for this Owner
Home Financials are based on the most recent Mortgage that was taken out on this home.
Original Mortgage
$56,260
Interest Rate
8.27%
Mortgage Type
New Conventional
Create a Home Valuation Report for This Property
The Home Valuation Report is an in-depth analysis detailing your home's value as well as a comparison with similar homes in the area
Home Values in the Area
Average Home Value in this Area
Purchase History
| Date | Buyer | Sale Price | Title Company |
|---|---|---|---|
| Bussey Family Trust | -- | None Listed On Document | |
| Bussey Douglas A | -- | Cardinal Title Company | |
| Spindler Betty E | $58,000 | -- |
Source: Public Records
Mortgage History
| Date | Status | Borrower | Loan Amount |
|---|---|---|---|
| Previous Owner | Bussey Douglas A | $54,000 | |
| Previous Owner | Spindler Betty E | $56,260 |
Source: Public Records
Tax History
| Year | Tax Paid | Tax Assessment Tax Assessment Total Assessment is a certain percentage of the fair market value that is determined by local assessors to be the total taxable value of land and additions on the property. | Land | Improvement |
|---|---|---|---|---|
| 2024 | $1,933 | $32,831 | $9,496 | $23,335 |
| 2023 | $1,933 | $32,831 | $9,496 | $23,335 |
| 2022 | $1,592 | $20,552 | $5,789 | $14,763 |
| 2021 | $1,593 | $20,552 | $5,789 | $14,763 |
| 2020 | $1,572 | $20,550 | $5,790 | $14,760 |
| 2019 | $1,513 | $17,840 | $6,270 | $11,570 |
| 2018 | $1,496 | $17,840 | $6,270 | $11,570 |
| 2017 | $1,516 | $17,840 | $6,270 | $11,570 |
| 2016 | $1,517 | $17,840 | $6,270 | $11,570 |
| 2015 | $1,516 | $17,840 | $6,270 | $11,570 |
| 2014 | $1,506 | $17,840 | $6,270 | $11,570 |
| 2013 | $1,485 | $17,920 | $6,270 | $11,650 |
Source: Public Records
Map
Nearby Homes
- 2513 Christensen Ave
- 2541 Nesmith Lake Blvd
- 364 Rexford St
- 2679 Edwin Ave
- 2407 Nesmith Lake Blvd
- 2255 Nesmith Lake Blvd
- 451 Allenford St
- 41 W Woodsdale Ave
- 590 Flora Ave
- 595 Flora Ave
- 636 Flora Ave
- 32 Joyce Ave
- 0 Joyce Ave NW Unit 35 5043152
- 0 Joyce Ave NW Unit 34 5043158
- 2256 Maryland Ave
- 30 Youtz Ave
- 76 Clinton Ave
- 600 Florida Ave
- 2286 6th St SW
- 835 Carnegie Ave
- 397 W Waterloo Rd
- 2533 Christensen Ave
- 391 W Waterloo Rd Unit 393
- 393 W Waterloo Rd
- 2529 Christensen Ave
- 2525 Christensen Ave
- 2550 Nesmith Lake Blvd
- 2534 Christensen Ave
- 387 W Waterloo Rd
- 404 W Waterloo Rd
- 400 W Waterloo Rd
- 2546 Nesmith Lake Blvd
- 2521 Christensen Ave
- 392 W Waterloo Rd
- 2542 Nesmith Lake Blvd
- 416 W Waterloo Rd
- 427 W Waterloo Rd
- 2524 Christensen Ave
- 2517 Christensen Ave
- 2538 Nesmith Lake Blvd