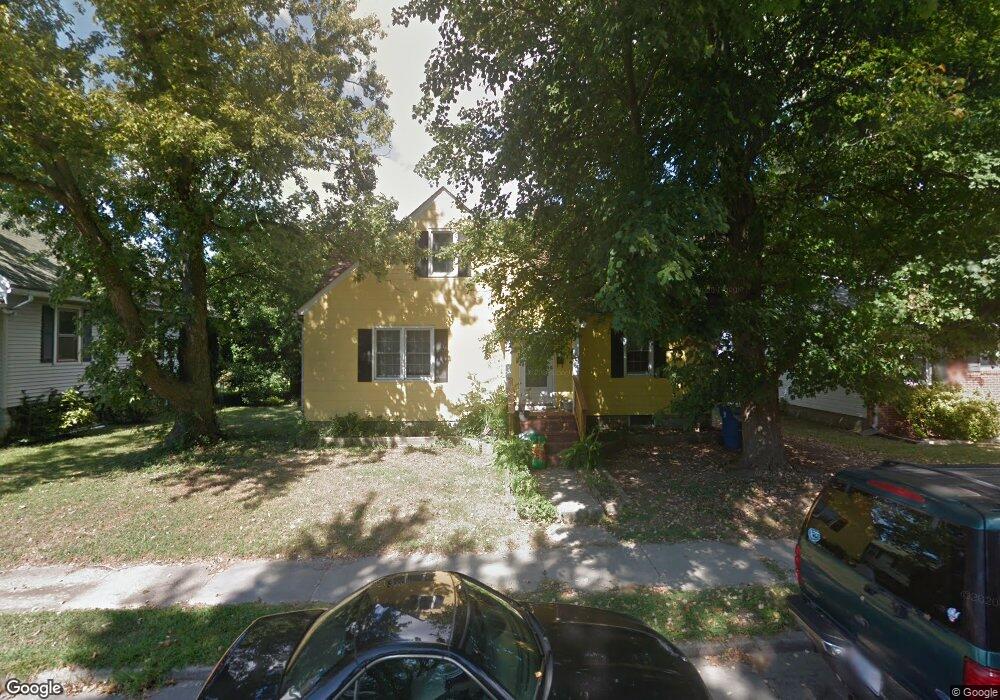
403 Winton Ave Easton, MD 21601
Estimated Value: $228,000 - $328,000
--
Bed
1
Bath
1,557
Sq Ft
$182/Sq Ft
Est. Value
About This Home
This home is located at 403 Winton Ave, Easton, MD 21601 and is currently estimated at $283,016, approximately $181 per square foot. 403 Winton Ave is a home located in Talbot County with nearby schools including Easton Elementary School, Easton Middle School, and Easton High School.
Ownership History
Date
Name
Owned For
Owner Type
Purchase Details
Closed on
May 27, 2008
Sold by
Kerns Jane A
Bought by
Fenick Alan M
Current Estimated Value
Home Financials for this Owner
Home Financials are based on the most recent Mortgage that was taken out on this home.
Original Mortgage
$121,813
Outstanding Balance
$77,726
Interest Rate
5.94%
Mortgage Type
VA
Estimated Equity
$205,290
Purchase Details
Closed on
May 12, 2008
Sold by
Kerns Jane A
Bought by
Fenick Alan M
Home Financials for this Owner
Home Financials are based on the most recent Mortgage that was taken out on this home.
Original Mortgage
$121,813
Outstanding Balance
$77,726
Interest Rate
5.94%
Mortgage Type
VA
Estimated Equity
$205,290
Purchase Details
Closed on
May 2, 2006
Sold by
Lukacsina George J
Bought by
Kerns Jane A
Purchase Details
Closed on
Apr 21, 2006
Sold by
Lukacsina George J
Bought by
Kerns Jane A
Purchase Details
Closed on
Mar 17, 2003
Sold by
Kerns Jane A
Bought by
Lukacsina George J and Kerns Jane A
Create a Home Valuation Report for This Property
The Home Valuation Report is an in-depth analysis detailing your home's value as well as a comparison with similar homes in the area
Home Values in the Area
Average Home Value in this Area
Purchase History
| Date | Buyer | Sale Price | Title Company |
|---|---|---|---|
| Fenick Alan M | $119,287 | -- | |
| Fenick Alan M | $119,287 | -- | |
| Kerns Jane A | -- | -- | |
| Kerns Jane A | -- | -- | |
| Lukacsina George J | -- | -- |
Source: Public Records
Mortgage History
| Date | Status | Borrower | Loan Amount |
|---|---|---|---|
| Open | Fenick Alan M | $121,813 | |
| Closed | Fenick Alan M | $121,813 |
Source: Public Records
Tax History Compared to Growth
Tax History
| Year | Tax Paid | Tax Assessment Tax Assessment Total Assessment is a certain percentage of the fair market value that is determined by local assessors to be the total taxable value of land and additions on the property. | Land | Improvement |
|---|---|---|---|---|
| 2025 | $1,129 | $195,367 | $0 | $0 |
| 2024 | $1,129 | $180,300 | $65,800 | $114,500 |
| 2023 | $1,054 | $173,400 | $0 | $0 |
| 2022 | $960 | $166,500 | $0 | $0 |
| 2021 | $883 | $159,600 | $52,500 | $107,100 |
| 2020 | $883 | $153,833 | $0 | $0 |
| 2019 | $876 | $148,067 | $0 | $0 |
| 2018 | $833 | $142,300 | $47,200 | $95,100 |
| 2017 | $782 | $142,300 | $0 | $0 |
| 2016 | $739 | $142,300 | $0 | $0 |
| 2015 | $694 | $144,700 | $0 | $0 |
| 2014 | $694 | $144,700 | $0 | $0 |
Source: Public Records
Map
Nearby Homes
- 203 E Earle Ave
- 305 S Aurora St
- 205 S Hanson St
- 30 Kelley Gibson St
- 20 S Aurora St
- 414 S Aurora St
- 115 South St
- 11 Brookletts Ave
- 305 Prospect Ave
- 10 N Park St
- 33 S Harrison St
- 13 N Thoroughgood Ln
- 12b Mistletoe Dr
- 506 Goldsborough St
- 26 S Washington St
- 412 Trippe Ave
- 601 Goldsborough St
- 607 North St
- 311 Salmon Ave
- 133 N Washington St