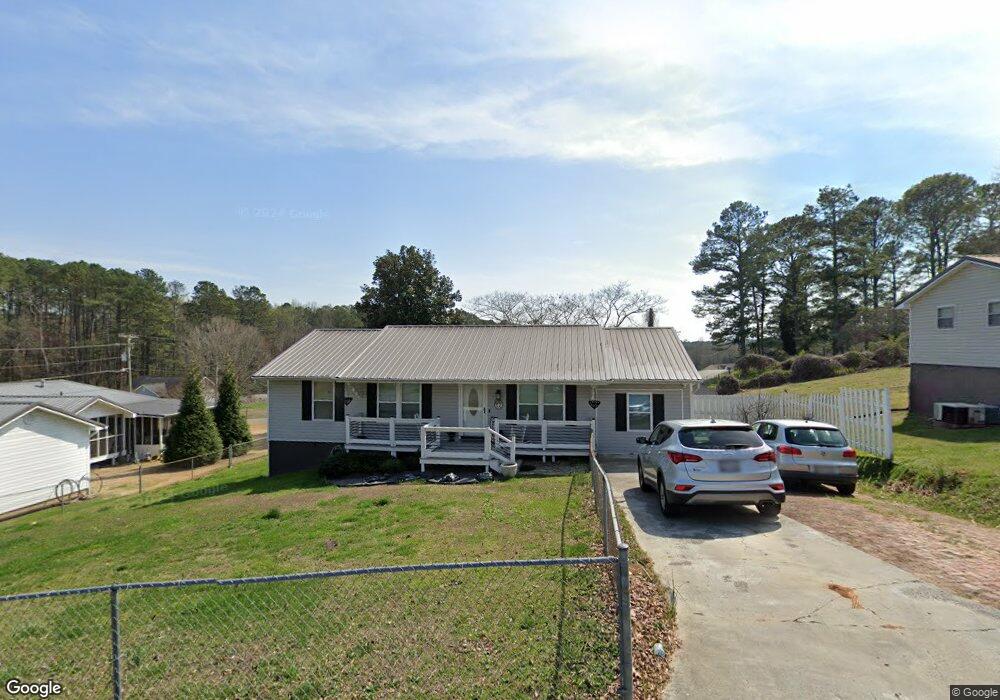
403 Wisteria Rd La Fayette, GA 30728
Estimated Value: $181,237 - $253,000
4
Beds
2
Baths
1,275
Sq Ft
$170/Sq Ft
Est. Value
About This Home
This home is located at 403 Wisteria Rd, La Fayette, GA 30728 and is currently estimated at $217,309, approximately $170 per square foot. 403 Wisteria Rd is a home located in Walker County with nearby schools including North Lafayette Elementary School, Lafayette Middle School, and Lafayette High School.
Ownership History
Date
Name
Owned For
Owner Type
Purchase Details
Closed on
Jun 8, 2000
Sold by
Qureshi Irfan
Bought by
Qureshi Irfan and Qureshi Lisa
Current Estimated Value
Purchase Details
Closed on
May 25, 2000
Sold by
Duvall Karen Y
Bought by
Qureshi Irfan
Purchase Details
Closed on
Dec 6, 1993
Sold by
United States Of America
Bought by
Duvall Karen Y
Purchase Details
Closed on
Jun 26, 1978
Sold by
Nelson Grady L and Nelson Elizabeth
Bought by
United States Of America
Purchase Details
Closed on
Apr 8, 1976
Sold by
Cantrell Junior L and Cantrell Birda
Bought by
Nelson Grady L and Nelson Elizabeth
Purchase Details
Closed on
Nov 5, 1973
Sold by
Stiles Stiles J and Stiles
Bought by
Cantrell Junior L and Cantrell Birda
Purchase Details
Closed on
Jan 1, 1972
Bought by
Stiles Stiles J and Stiles
Create a Home Valuation Report for This Property
The Home Valuation Report is an in-depth analysis detailing your home's value as well as a comparison with similar homes in the area
Home Values in the Area
Average Home Value in this Area
Purchase History
| Date | Buyer | Sale Price | Title Company |
|---|---|---|---|
| Qureshi Irfan | -- | -- | |
| Qureshi Irfan | $69,900 | -- | |
| Duvall Karen Y | $44,900 | -- | |
| United States Of America | -- | -- | |
| Nelson Grady L | -- | -- | |
| Cantrell Junior L | $21,000 | -- | |
| Stiles Stiles J | -- | -- |
Source: Public Records
Tax History Compared to Growth
Tax History
| Year | Tax Paid | Tax Assessment Tax Assessment Total Assessment is a certain percentage of the fair market value that is determined by local assessors to be the total taxable value of land and additions on the property. | Land | Improvement |
|---|---|---|---|---|
| 2024 | $1,637 | $70,866 | $2,000 | $68,866 |
| 2023 | $1,593 | $67,069 | $2,000 | $65,069 |
| 2022 | $1,459 | $57,426 | $2,000 | $55,426 |
| 2021 | $1,208 | $43,146 | $2,000 | $41,146 |
| 2020 | $953 | $33,078 | $2,000 | $31,078 |
| 2019 | $954 | $33,078 | $2,000 | $31,078 |
| 2018 | $984 | $33,078 | $2,000 | $31,078 |
| 2017 | $1,041 | $33,078 | $2,000 | $31,078 |
| 2016 | $967 | $37,078 | $6,000 | $31,078 |
| 2015 | $923 | $33,909 | $6,000 | $27,909 |
| 2014 | $889 | $33,909 | $6,000 | $27,909 |
| 2013 | -- | $33,908 | $6,000 | $27,908 |
Source: Public Records
Map
Nearby Homes
- 393 Wisteria Rd
- 1303 Campbell Crescent
- 1309 Campbell Crescent
- 1314 Fernwood Dr
- 79 Hobart Ln
- 1118 Probasco St N
- 1403 N Main St
- 302 Ridgecrest Dr
- 307 Ridgecrest Dr
- 329 Windsong Dr
- 105 Stanfield Rd
- 1520 N Main St
- 1001 N Main St
- 1876 Old Mineral Springs Rd
- 111 Dove Dr
- 114 Mallard Ln
- 214 East Ave
- 71 McCarter Rd
- 307 Park St
- 0 Center St Unit 1517720
- 401 Wisteria Rd
- 1300 Fernwood Dr
- 407 Wisteria Rd
- 404 Wisteria Rd
- 399 Wisteria Rd
- 1302 Fernwood Dr
- 1210 Probasco St N
- 406 Wisteria Rd
- 409 Wisteria Rd
- 1208 Probasco St N
- 1212 Probasco St N
- 398 Wisteria Rd
- 405 Campbell Crescent
- 397 Wisteria Rd
- 1206 Probasco St N
- 408 Wisteria Rd
- 1304 Fernwood Dr
- 411 Wisteria Rd
- 407 Campbell Crescent
- 301 Campbell Crescent