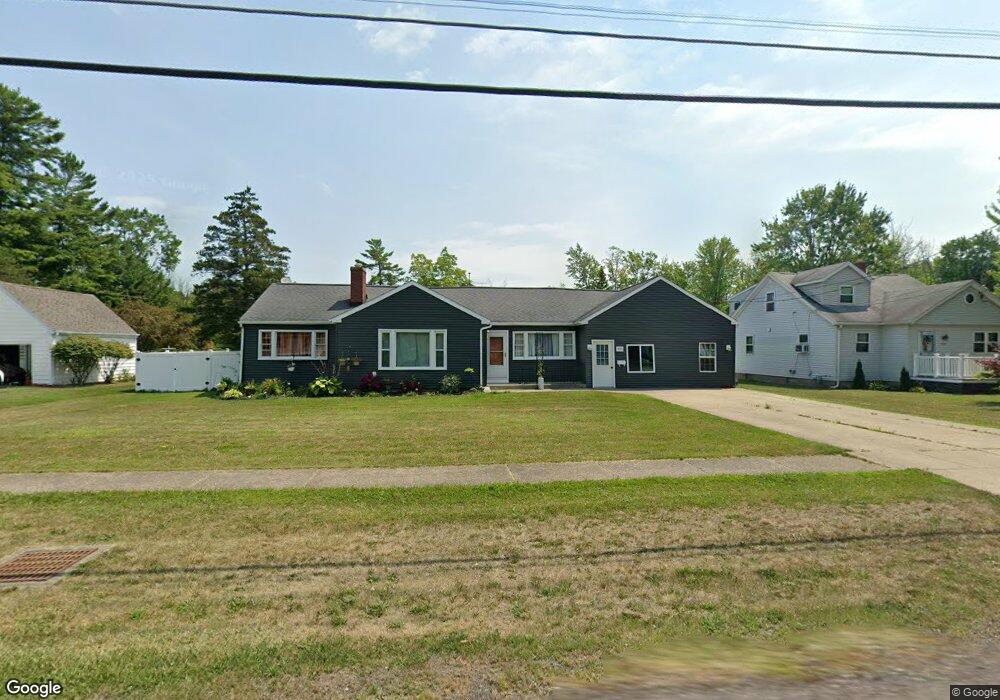
403 Witmer Rd North Tonawanda, NY 14120
Estimated Value: $182,000 - $262,139
3
Beds
1
Bath
1,553
Sq Ft
$142/Sq Ft
Est. Value
About This Home
This home is located at 403 Witmer Rd, North Tonawanda, NY 14120 and is currently estimated at $219,785, approximately $141 per square foot. 403 Witmer Rd is a home located in Niagara County with nearby schools including Drake School, St. John Lutheran School, and St Matthew Lutheran School.
Ownership History
Date
Name
Owned For
Owner Type
Purchase Details
Closed on
Feb 27, 2025
Sold by
Newton Charles
Bought by
Kutlak Gary
Current Estimated Value
Purchase Details
Closed on
Apr 3, 2019
Sold by
Newton Kathryn G and Newton Marvin E
Bought by
Newton Charles
Home Financials for this Owner
Home Financials are based on the most recent Mortgage that was taken out on this home.
Original Mortgage
$89,514
Interest Rate
5.5%
Mortgage Type
FHA
Create a Home Valuation Report for This Property
The Home Valuation Report is an in-depth analysis detailing your home's value as well as a comparison with similar homes in the area
Home Values in the Area
Average Home Value in this Area
Purchase History
| Date | Buyer | Sale Price | Title Company |
|---|---|---|---|
| Kutlak Gary | $170,000 | None Listed On Document | |
| Newton Charles | $91,500 | None Available |
Source: Public Records
Mortgage History
| Date | Status | Borrower | Loan Amount |
|---|---|---|---|
| Previous Owner | Newton Charles | $89,514 |
Source: Public Records
Tax History Compared to Growth
Tax History
| Year | Tax Paid | Tax Assessment Tax Assessment Total Assessment is a certain percentage of the fair market value that is determined by local assessors to be the total taxable value of land and additions on the property. | Land | Improvement |
|---|---|---|---|---|
| 2024 | $3,704 | $104,900 | $29,500 | $75,400 |
| 2023 | $3,612 | $104,900 | $29,500 | $75,400 |
| 2022 | $3,572 | $104,900 | $29,500 | $75,400 |
| 2021 | $3,548 | $104,900 | $29,500 | $75,400 |
| 2020 | $3,672 | $104,900 | $29,500 | $75,400 |
| 2019 | $1,324 | $104,900 | $29,500 | $75,400 |
| 2018 | $3,207 | $104,900 | $29,500 | $75,400 |
| 2017 | $1,873 | $104,900 | $29,500 | $75,400 |
| 2016 | $1,767 | $104,900 | $29,500 | $75,400 |
| 2015 | -- | $104,900 | $29,500 | $75,400 |
| 2014 | -- | $104,900 | $29,500 | $75,400 |
Source: Public Records
Map
Nearby Homes