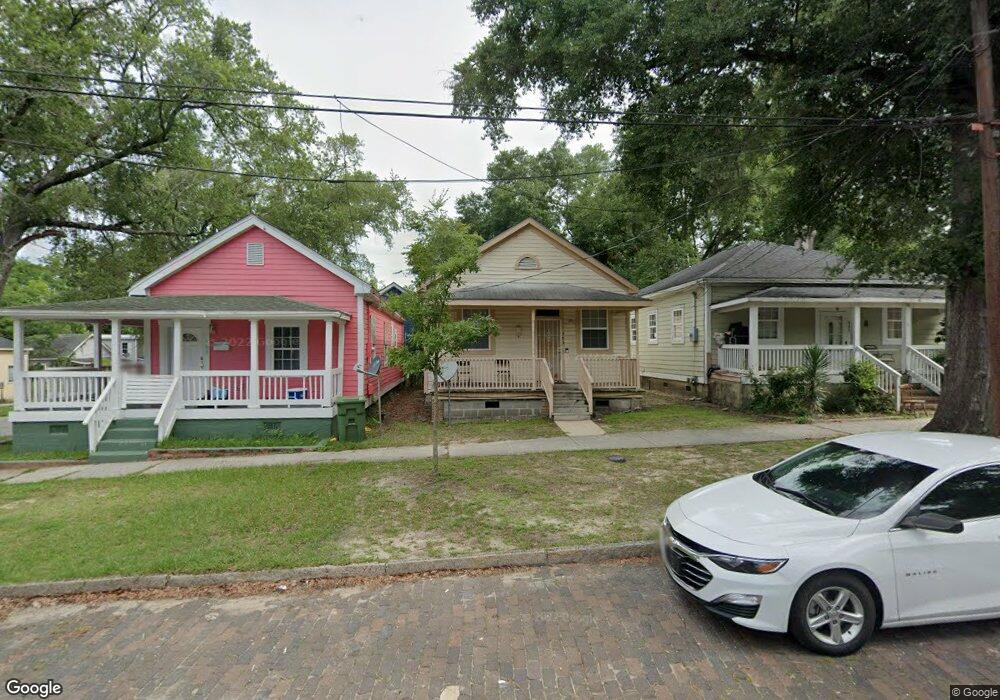
403 Wright St Wilmington, NC 28401
Dry Pond-South Side NeighborhoodEstimated Value: $225,000 - $367,000
3
Beds
1
Bath
748
Sq Ft
$353/Sq Ft
Est. Value
About This Home
This home is located at 403 Wright St, Wilmington, NC 28401 and is currently estimated at $264,113, approximately $353 per square foot. 403 Wright St is a home located in New Hanover County with nearby schools including Snipes Academy of Arts & Design, Williston Middle School, and New Hanover High School.
Ownership History
Date
Name
Owned For
Owner Type
Purchase Details
Closed on
Mar 22, 1999
Sold by
Studio 4 Inc
Bought by
Broadwater Ronnie L
Current Estimated Value
Purchase Details
Closed on
Oct 5, 1992
Sold by
Rattley James
Bought by
Studio 4 Inc
Purchase Details
Closed on
Jan 1, 1992
Sold by
Rattley James Essie
Bought by
Rattley James
Purchase Details
Closed on
Feb 2, 1989
Sold by
Johnson Kathy Marie
Bought by
Rattley James Essie
Purchase Details
Closed on
May 1, 1983
Sold by
Bradley Clayton
Bought by
Johnson Kathy Marie
Purchase Details
Closed on
Aug 1, 1981
Sold by
Murray Richard J
Bought by
Bradley Clayton
Purchase Details
Closed on
Dec 1, 1966
Bought by
Murray Richard J
Create a Home Valuation Report for This Property
The Home Valuation Report is an in-depth analysis detailing your home's value as well as a comparison with similar homes in the area
Home Values in the Area
Average Home Value in this Area
Purchase History
| Date | Buyer | Sale Price | Title Company |
|---|---|---|---|
| Broadwater Ronnie L | $8,000 | -- | |
| Studio 4 Inc | -- | -- | |
| Rattley James | -- | -- | |
| Rattley James Essie | $6,000 | -- | |
| Johnson Kathy Marie | -- | -- | |
| Bradley Clayton | -- | -- | |
| Murray Richard J | -- | -- |
Source: Public Records
Tax History
| Year | Tax Paid | Tax Assessment Tax Assessment Total Assessment is a certain percentage of the fair market value that is determined by local assessors to be the total taxable value of land and additions on the property. | Land | Improvement |
|---|---|---|---|---|
| 2025 | $1,332 | $226,300 | $65,000 | $161,300 |
| 2023 | $764 | $90,400 | $28,300 | $62,100 |
| 2022 | $768 | $90,400 | $28,300 | $62,100 |
| 2021 | $774 | $90,400 | $28,300 | $62,100 |
| 2020 | $499 | $47,400 | $24,400 | $23,000 |
| 2019 | $499 | $47,400 | $24,400 | $23,000 |
| 2018 | $499 | $47,400 | $24,400 | $23,000 |
| 2017 | $499 | $47,400 | $24,400 | $23,000 |
| 2016 | $654 | $59,000 | $26,800 | $32,200 |
| 2015 | $625 | $59,000 | $26,800 | $32,200 |
| 2014 | $598 | $59,000 | $26,800 | $32,200 |
Source: Public Records
Map
Nearby Homes
Your Personal Tour Guide
Ask me questions while you tour the home.