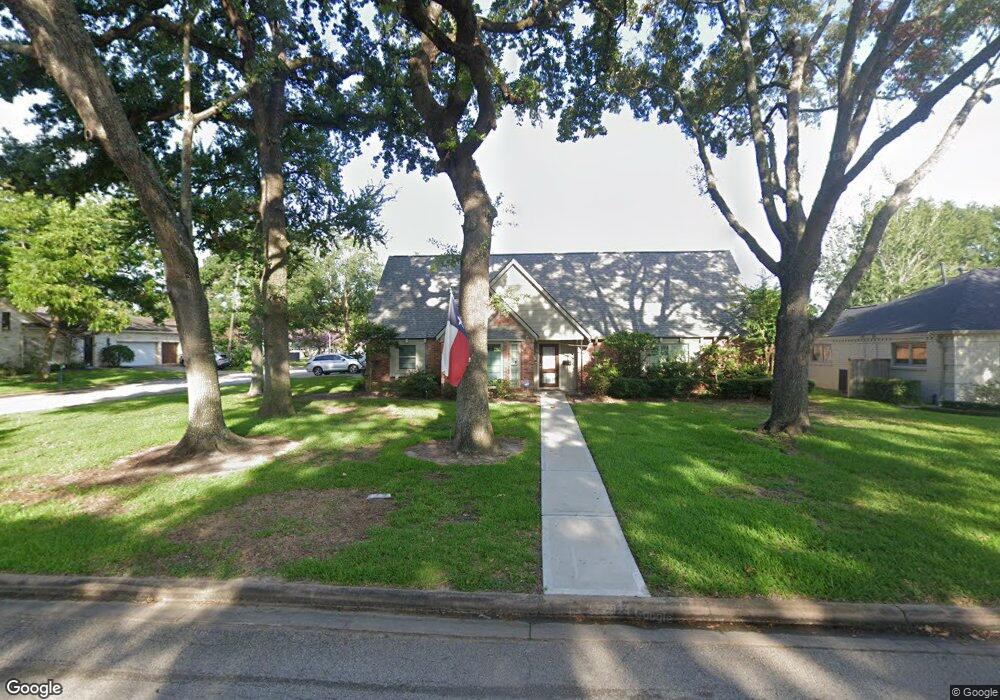
403 Wycliffe Dr Houston, TX 77079
Memorial NeighborhoodEstimated Value: $904,000 - $966,000
4
Beds
3
Baths
2,546
Sq Ft
$365/Sq Ft
Est. Value
About This Home
This home is located at 403 Wycliffe Dr, Houston, TX 77079 and is currently estimated at $928,391, approximately $364 per square foot. 403 Wycliffe Dr is a home located in Harris County with nearby schools including Rummel Creek Elementary School, Memorial Middle, and Stratford High School.
Ownership History
Date
Name
Owned For
Owner Type
Purchase Details
Closed on
Dec 21, 2007
Sold by
Kim Wan Jun and Kim Hyun Joo
Bought by
Wong Kevin and Wong Connie
Current Estimated Value
Home Financials for this Owner
Home Financials are based on the most recent Mortgage that was taken out on this home.
Original Mortgage
$318,044
Outstanding Balance
$200,892
Interest Rate
6.26%
Mortgage Type
Purchase Money Mortgage
Estimated Equity
$727,499
Purchase Details
Closed on
Apr 30, 2002
Sold by
Prewitt Irene D and Prewitt Davidson H
Bought by
Kim Wan Jun and Kim Hyun Joo
Home Financials for this Owner
Home Financials are based on the most recent Mortgage that was taken out on this home.
Original Mortgage
$222,400
Interest Rate
7.11%
Purchase Details
Closed on
Jan 31, 1995
Sold by
Breunig Peter A and Breunig Elizabeth M
Bought by
Prewitt Irene D
Create a Home Valuation Report for This Property
The Home Valuation Report is an in-depth analysis detailing your home's value as well as a comparison with similar homes in the area
Home Values in the Area
Average Home Value in this Area
Purchase History
| Date | Buyer | Sale Price | Title Company |
|---|---|---|---|
| Wong Kevin | -- | Texas American Title Company | |
| Kim Wan Jun | -- | Charter Title Company | |
| Prewitt Irene D | -- | Stewart Title Company |
Source: Public Records
Mortgage History
| Date | Status | Borrower | Loan Amount |
|---|---|---|---|
| Open | Wong Kevin | $318,044 | |
| Previous Owner | Kim Wan Jun | $222,400 | |
| Closed | Kim Wan Jun | $27,800 |
Source: Public Records
Tax History Compared to Growth
Tax History
| Year | Tax Paid | Tax Assessment Tax Assessment Total Assessment is a certain percentage of the fair market value that is determined by local assessors to be the total taxable value of land and additions on the property. | Land | Improvement |
|---|---|---|---|---|
| 2025 | $12,537 | $869,589 | $587,500 | $282,089 |
| 2024 | $12,537 | $771,988 | $528,750 | $243,238 |
| 2023 | $12,537 | $740,000 | $528,750 | $211,250 |
| 2022 | $17,326 | $741,103 | $528,750 | $212,353 |
| 2021 | $16,822 | $689,000 | $499,375 | $189,625 |
| 2020 | $16,171 | $645,400 | $499,375 | $146,025 |
| 2019 | $16,001 | $684,501 | $499,375 | $185,126 |
| 2018 | $5,438 | $684,501 | $499,375 | $185,126 |
| 2017 | $13,214 | $684,501 | $499,375 | $185,126 |
| 2016 | $12,013 | $684,501 | $499,375 | $185,126 |
| 2015 | $7,871 | $684,501 | $499,375 | $185,126 |
| 2014 | $7,871 | $640,287 | $411,250 | $229,037 |
Source: Public Records
Map
Nearby Homes
- 334 Wycliffe Dr
- 414 E Gaywood Dr
- 13403 Taylorcrest Rd
- 13131 Kimberley Ln
- 807 Wycliffe Dr
- 127 Gershwin Dr
- 327 Electra Dr
- 210 Big Hollow Ln
- 12910 Traviata Dr
- 12903 Tosca Ln
- 203 Cove Creek Ln
- 839 Wax Myrtle Ln
- 12815 Traviata Dr
- 360 Wilcrest Dr Unit 360
- 600 Wilcrest Dr Unit 66
- 12810 Figaro Dr
- 13004 Trail Hollow Dr Unit A
- 893 Wax Myrtle Ln Unit 3
- 903 Wax Myrtle Ln
- 921 Wax Myrtle Ln
- 407 Wycliffe Dr
- 402 N Wilcrest Dr
- 363 Wycliffe Dr
- 406 N Wilcrest Dr
- 411 Wycliffe Dr
- 402 Wycliffe Dr
- 410 N Wilcrest Dr
- 359 Wycliffe Dr
- 362 Wycliffe Dr
- 415 Wycliffe Dr
- 410 Wycliffe Dr
- 414 N Wilcrest Dr
- 358 Wycliffe Dr
- 414 Wycliffe Dr
- 13302 Apple Tree Rd
- 419 Wycliffe Dr
- 326 N Wilcrest Dr
- 418 N Wilcrest Dr
- 13303 Apple Tree Rd
- 354 Wycliffe Dr