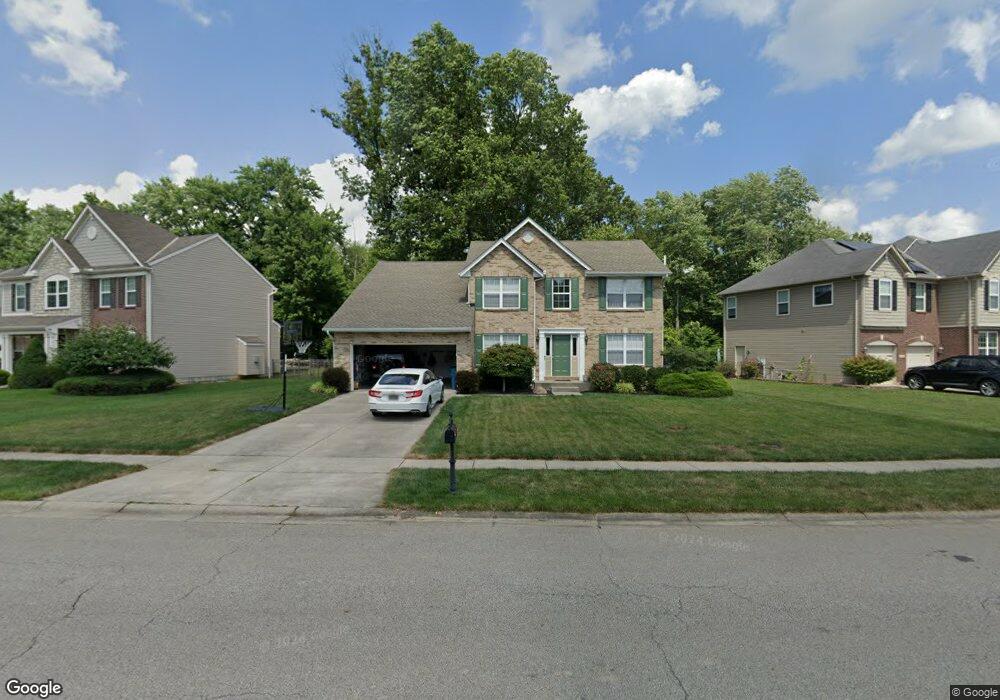
4030 Andora Blvd Unit 48 Amelia, OH 45102
Estimated Value: $406,880 - $466,000
4
Beds
3
Baths
2,348
Sq Ft
$188/Sq Ft
Est. Value
About This Home
This home is located at 4030 Andora Blvd Unit 48, Amelia, OH 45102 and is currently estimated at $440,470, approximately $187 per square foot. 4030 Andora Blvd Unit 48 is a home located in Clermont County with nearby schools including Merwin Elementary School, West Clermont Middle School, and West Clermont High School.
Ownership History
Date
Name
Owned For
Owner Type
Purchase Details
Closed on
Jul 1, 2015
Sold by
Huth Michael J and Huth Sandra I
Bought by
Chase David and Chase Tonya
Current Estimated Value
Home Financials for this Owner
Home Financials are based on the most recent Mortgage that was taken out on this home.
Original Mortgage
$225,000
Outstanding Balance
$175,442
Interest Rate
3.86%
Mortgage Type
Unknown
Estimated Equity
$265,028
Purchase Details
Closed on
Nov 9, 2007
Sold by
Schmidt Builders Inc
Bought by
Huth Michael J and Huth Sandra I
Home Financials for this Owner
Home Financials are based on the most recent Mortgage that was taken out on this home.
Original Mortgage
$200,000
Interest Rate
6.47%
Mortgage Type
Unknown
Purchase Details
Closed on
Sep 18, 2006
Sold by
Developers Of Clermont County Llc
Bought by
Schmidt Builders Inc
Create a Home Valuation Report for This Property
The Home Valuation Report is an in-depth analysis detailing your home's value as well as a comparison with similar homes in the area
Home Values in the Area
Average Home Value in this Area
Purchase History
| Date | Buyer | Sale Price | Title Company |
|---|---|---|---|
| Chase David | $240,000 | Prominent Title Agency Llc | |
| Huth Michael J | $250,000 | Prodigy Title Agency Llc | |
| Schmidt Builders Inc | $388,000 | None Available |
Source: Public Records
Mortgage History
| Date | Status | Borrower | Loan Amount |
|---|---|---|---|
| Open | Chase David | $225,000 | |
| Previous Owner | Huth Michael J | $200,000 |
Source: Public Records
Tax History Compared to Growth
Tax History
| Year | Tax Paid | Tax Assessment Tax Assessment Total Assessment is a certain percentage of the fair market value that is determined by local assessors to be the total taxable value of land and additions on the property. | Land | Improvement |
|---|---|---|---|---|
| 2024 | $5,749 | $123,240 | $21,740 | $101,500 |
| 2023 | $5,764 | $123,240 | $21,740 | $101,500 |
| 2022 | $4,510 | $85,330 | $15,050 | $70,280 |
| 2021 | $4,535 | $85,330 | $15,050 | $70,280 |
| 2020 | $4,544 | $85,330 | $15,050 | $70,280 |
| 2019 | $3,419 | $71,060 | $10,680 | $60,380 |
| 2018 | $3,455 | $71,060 | $10,680 | $60,380 |
| 2017 | $3,487 | $71,060 | $10,680 | $60,380 |
| 2016 | $3,487 | $65,210 | $9,800 | $55,410 |
| 2015 | $3,315 | $65,210 | $9,800 | $55,410 |
| 2014 | $3,315 | $65,210 | $9,800 | $55,410 |
| 2013 | $3,556 | $68,920 | $16,980 | $51,940 |
Source: Public Records
Map
Nearby Homes
- 1218 Twin Gate Run
- 1190 Twin Gate Run
- 1559 Driftwood Ct
- 315 Judd Rd
- 1211 Millstream Dr
- Alberti Ranch with Finished Basement Plan at Rosewood
- Bramante Ranch with Finished Basement Plan at Rosewood
- Columbia with Finished Basement Plan at Rosewood
- Allegheny with Finished Basement Plan at Rosewood
- Ballenger with Finished Basement Plan at Rosewood
- 4 Gumbert Dr
- 1570 Wildbrook Ct
- 1559 Clearbrook Ln
- 1590 Clearbrook Ln
- 5 Woodruff Ln
- 96 Amelia Olive Branch Rd
- 1234 Millstream Dr
- 85 Glen Mary Dr
- 3915 Pebble Creek Ln
- 1201 Millstream Dr
- 4030 Andora Blvd
- 4032 Andora Blvd
- 4028 Andora Blvd
- 4026 Andora Blvd
- 4034 Andora Blvd
- 1205 Sundew Ct
- 29 Andora Blvd
- 4029 Andora Blvd
- 4024 Andora Blvd
- 41 Twin Gate Run
- 1203 Sundew Ct
- 4027 Andora Blvd
- 1204 Sundew Ct
- 4035 Andora Blvd
- 4022 Andora Blvd
- 4025 Andora Blvd
- 1202 Sundew Ct
- 4025 Aster Ct
- 1201 Sundew Ct
- 4027 Aster Ct