4030 N Kickapoo Ave Shawnee, OK 74804
Estimated Value: $4,171,749
3
Beds
2
Baths
6,840
Sq Ft
$610/Sq Ft
Est. Value
About This Home
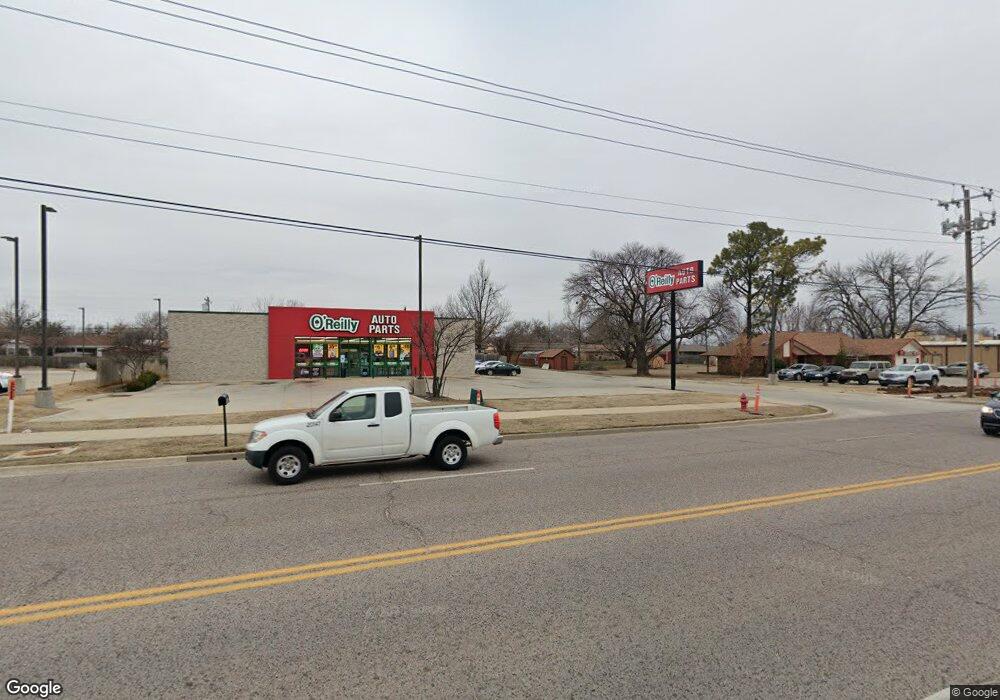
This home is located at 4030 N Kickapoo Ave, Shawnee, OK 74804 and is currently estimated at $4,171,749, approximately $609 per square foot. 4030 N Kickapoo Ave is a home located in Pottawatomie County with nearby schools including Will Rogers Elementary School, Shawnee Middle School, and Shawnee High School.
Ownership History
Date
Name
Owned For
Owner Type
Purchase Details
Closed on
Dec 27, 2017
Sold by
Shawnee Marketplace Investors Lp
Bought by
Mason Amir Properties Llc
Current Estimated Value
Home Financials for this Owner
Home Financials are based on the most recent Mortgage that was taken out on this home.
Original Mortgage
$1,525,000
Interest Rate
3.95%
Mortgage Type
Commercial
Purchase Details
Closed on
Dec 21, 2012
Sold by
Cutlip Theresa Vashi and Lawson Michael B
Bought by
Lawson Michael B and Lawson Mike
Purchase Details
Closed on
Aug 28, 2012
Sold by
Romine Jack L and Romine Tamara R
Bought by
Oreilly Automotive Stores Inc
Purchase Details
Closed on
Sep 22, 2006
Sold by
Davis Floyd W and Davis Juanita V
Bought by
Romine Jack L and Romine Tamara R
Home Financials for this Owner
Home Financials are based on the most recent Mortgage that was taken out on this home.
Original Mortgage
$141,550
Interest Rate
6.55%
Mortgage Type
Commercial
Create a Home Valuation Report for This Property
The Home Valuation Report is an in-depth analysis detailing your home's value as well as a comparison with similar homes in the area
Purchase History
| Date | Buyer | Sale Price | Title Company |
|---|---|---|---|
| Mason Amir Properties Llc | $2,466,167 | None Available | |
| Lawson Michael B | -- | None Available | |
| Oreilly Automotive Stores Inc | $330,000 | Trustmark Title | |
| Romine Jack L | $149,000 | None Available |
Source: Public Records
Mortgage History
| Date | Status | Borrower | Loan Amount |
|---|---|---|---|
| Closed | Mason Amir Properties Llc | $1,525,000 | |
| Previous Owner | Romine Jack L | $141,550 |
Source: Public Records
Tax History
| Year | Tax Paid | Tax Assessment Tax Assessment Total Assessment is a certain percentage of the fair market value that is determined by local assessors to be the total taxable value of land and additions on the property. | Land | Improvement |
|---|---|---|---|---|
| 2025 | $7,742 | $78,907 | $8,316 | $70,591 |
| 2024 | $7,851 | $75,149 | $7,920 | $67,229 |
| 2023 | $7,851 | $75,149 | $7,920 | $67,229 |
| 2022 | $7,710 | $75,149 | $7,920 | $67,229 |
| 2021 | $7,572 | $75,149 | $7,920 | $67,229 |
| 2020 | $7,695 | $76,161 | $7,920 | $68,241 |
| 2019 | $7,899 | $75,658 | $7,758 | $67,900 |
| 2018 | $7,373 | $72,056 | $7,287 | $64,769 |
| 2017 | $6,925 | $68,624 | $7,716 | $60,908 |
| 2016 | $6,669 | $65,357 | $6,300 | $59,057 |
| 2015 | $3,956 | $39,555 | $6,000 | $33,555 |
| 2014 | $3,956 | $39,555 | $6,000 | $33,555 |
Source: Public Records
Map
Nearby Homes
- 4206 N Aydelotte Ave
- 4207 N Chapman Ave
- 4408 N Chapman Ave
- 312 Traditional Way Ct
- 4105 N Chapman Ave
- 3 Rock Hollow Rd
- 4009 Pine Ridge Rd
- 10 Red Oak Rd
- 7 N Tawana Dr
- 29 Timber Creek Way
- 13 Robby Rd
- 000 45th and Union Lot 3
- 000 45th and Union Lot 2
- 000 45th and Union Lot 1
- 41 Timber Creek Dr
- 000 45th and Union Lot 6
- 000 45th and Union Lot 4
- 000 45th and Union Lot 5
- 000 45th and Union Lot 7
- 3406 N Market Ave
- 4020 N Kickapoo Ave
- 4337 N Kickapoo Ave
- 4309 N Aydelotte Ave
- 4311 N Aydelotte Ave
- 4331 N Kickapoo Ave
- 4325 N Kickapoo Ave
- 4325 N Kickapoo Ave
- 4401 N Aydelotte Ave
- 4305 N Aydelotte Ave
- 4403 N Aydelotte Ave
- 4410 N Kickapoo Ave
- 4401 N Kickapoo Ave
- 4405 N Aydelotte Ave
- 4303 N Aydelotte Ave
- 4325 N Ave
- 4325 & 4331 & 4337 N Kickapoo Ave
- 4308 N Aydelotte Ave
- 4310 N Aydelotte Ave
- 4420 N Kickapoo Ave
- 4407 N Aydelotte Ave
Your Personal Tour Guide
Ask me questions while you tour the home.