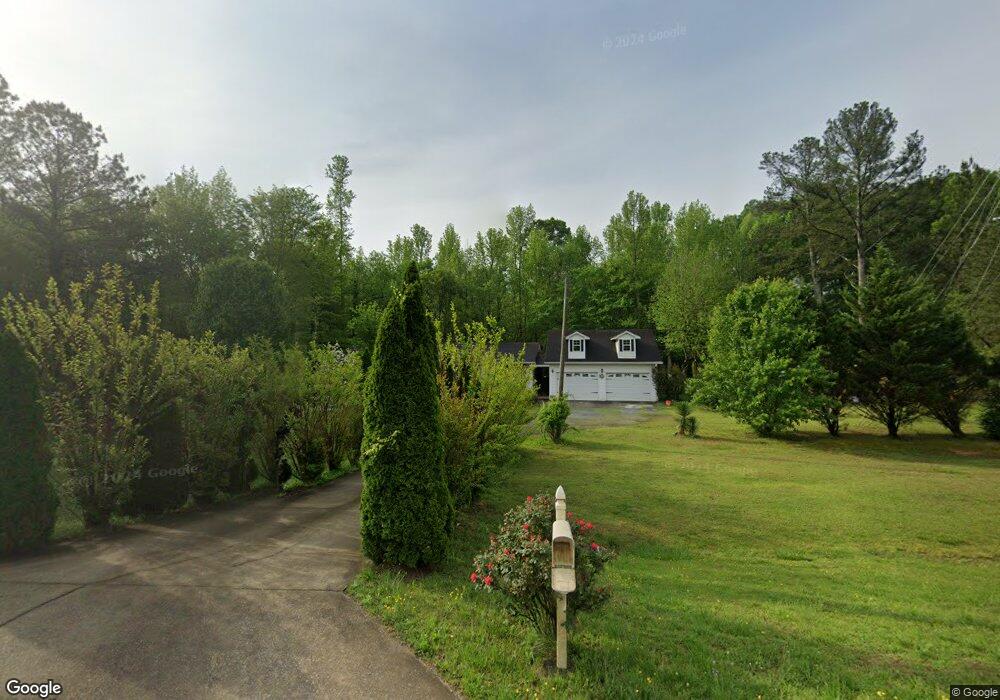
4030 Rockmart Hwy Cedartown, GA 30125
Estimated Value: $185,000 - $257,698
3
Beds
2
Baths
2,139
Sq Ft
$102/Sq Ft
Est. Value
About This Home
This home is located at 4030 Rockmart Hwy, Cedartown, GA 30125 and is currently estimated at $217,175, approximately $101 per square foot. 4030 Rockmart Hwy is a home located in Polk County with nearby schools including Rockmart Middle School.
Ownership History
Date
Name
Owned For
Owner Type
Purchase Details
Closed on
May 3, 1996
Sold by
Long Jerry W
Bought by
Pizano David
Current Estimated Value
Purchase Details
Closed on
Mar 14, 1994
Sold by
Payne Noel J
Bought by
Long Jerry W
Purchase Details
Closed on
Apr 23, 1990
Sold by
Farmers Home Adm
Bought by
Payne Noel J
Purchase Details
Closed on
Apr 4, 1990
Sold by
Wook Dana Clark
Bought by
Farmers Home Admin
Purchase Details
Closed on
Aug 10, 1989
Sold by
Wood Denny E
Bought by
Farmers Home Admin
Purchase Details
Closed on
Jan 1, 1979
Sold by
Fincher Wendell W
Bought by
Wood Denny and Wood Dana K
Purchase Details
Closed on
Jan 1, 1978
Sold by
Peoples Bank Trustee
Bought by
Fincher Wendell W
Purchase Details
Closed on
Sep 30, 1976
Sold by
Home Mart Building
Bought by
Peoples Bank Trustee
Purchase Details
Closed on
Sep 11, 1973
Sold by
Thomas Pearl C
Bought by
Home Mart Build Inc
Purchase Details
Closed on
Feb 3, 1971
Sold by
Thomas Joe D
Bought by
Thomas Pearl D
Purchase Details
Closed on
Nov 1, 1966
Bought by
Thomas Joe D
Create a Home Valuation Report for This Property
The Home Valuation Report is an in-depth analysis detailing your home's value as well as a comparison with similar homes in the area
Home Values in the Area
Average Home Value in this Area
Purchase History
| Date | Buyer | Sale Price | Title Company |
|---|---|---|---|
| Pizano David | $44,900 | -- | |
| Long Jerry W | $36,000 | -- | |
| Payne Noel J | -- | -- | |
| Farmers Home Admin | -- | -- | |
| Farmers Home Admin | -- | -- | |
| Wood Denny | -- | -- | |
| Fincher Wendell W | -- | -- | |
| Peoples Bank Trustee | -- | -- | |
| Home Mart Build Inc | -- | -- | |
| Thomas Pearl D | -- | -- | |
| Thomas Joe D | -- | -- |
Source: Public Records
Tax History Compared to Growth
Tax History
| Year | Tax Paid | Tax Assessment Tax Assessment Total Assessment is a certain percentage of the fair market value that is determined by local assessors to be the total taxable value of land and additions on the property. | Land | Improvement |
|---|---|---|---|---|
| 2024 | $1,686 | $80,675 | $3,569 | $77,106 |
| 2023 | $1,429 | $60,224 | $3,569 | $56,655 |
| 2022 | $1,232 | $53,928 | $2,379 | $51,549 |
| 2021 | $1,248 | $53,928 | $2,379 | $51,549 |
| 2020 | $1,251 | $53,928 | $2,379 | $51,549 |
| 2019 | $1,173 | $45,689 | $2,379 | $43,310 |
| 2018 | $1,175 | $44,656 | $2,379 | $42,277 |
| 2017 | $1,161 | $44,656 | $2,379 | $42,277 |
| 2016 | $1,142 | $43,977 | $1,700 | $42,277 |
| 2015 | $1,175 | $45,041 | $1,700 | $43,341 |
| 2014 | $843 | $32,671 | $1,700 | $30,971 |
Source: Public Records
Map
Nearby Homes
- 2020 Old Cedartown Rd
- 1907 Old Cedartown Rd
- 536 Wimberly Hill Rd
- 3323 Rockmart Hwy
- 394 Knight Rd
- 1157 Stringer Rd
- 247 Grady Rd
- 0 Pine Mountain Rd Unit 7662185
- 0 Pine Mountain Rd Unit 10478395
- 0 Pine Mountain Rd Unit 7540784
- 470 Knight Rd
- 600 Grady Rd
- 93 Clay Rd
- 94 Wimberly Hill Loop
- 1039 Old Cedartown Rd
- 0 Richard Pullen Rd Unit 10577442
- 0 Richard Pullen Rd Unit 7626794
- 0 Benefield Rd Unit 7479734
- 0 Benefield Rd Unit 10405501
- 1211 Bellview Rd
- 4041 Rockmart Hwy
- 4005 Rockmart Hwy
- 2194 Old Cedartown Rd
- 3961 Rockmart Hwy
- 2158 Old Cedartown Rd
- 2144 Old Cedartown Rd
- 2144 Bethlehem Rd
- 2155 Old Cedartown Rd
- 2303 Old Cedartown Rd
- 50 Bethlehem Rd
- 40 Bethlehem Rd
- 2319 Old Cedartown Rd
- 133 Airport Rd
- 2327 Old Cedartown Rd
- 1-2 Bethlehem Church Rd
- 0 Bethlehem Rd Unit 8350960
- 0 Bethlehem Rd Unit 7094730
- 0 Bethlehem Rd Unit 7081806
- 0 Bethlehem Church Rd Unit 9 7233914
- 0 Bethlehem Church Rd Unit 11 7233930