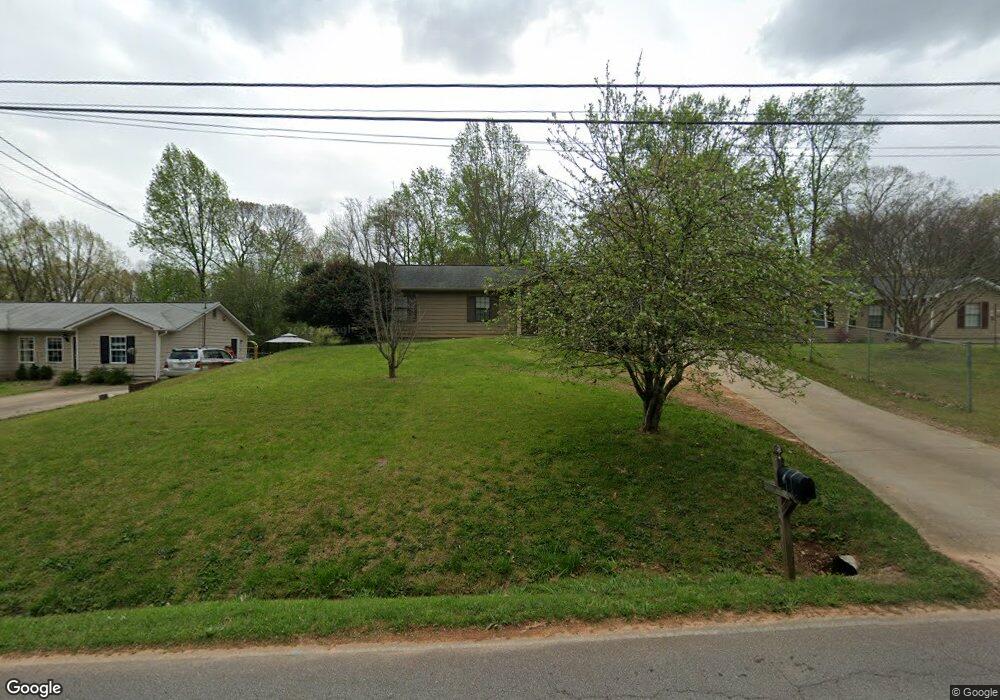
4030 Warren Rd Flowery Branch, GA 30542
Estimated Value: $269,000 - $301,000
3
Beds
2
Baths
1,100
Sq Ft
$256/Sq Ft
Est. Value
About This Home
This home is located at 4030 Warren Rd, Flowery Branch, GA 30542 and is currently estimated at $281,146, approximately $255 per square foot. 4030 Warren Rd is a home located in Hall County with nearby schools including Martin Elementary School, Southwest Middle School, and C.W. Davis Middle School.
Ownership History
Date
Name
Owned For
Owner Type
Purchase Details
Closed on
Apr 28, 2015
Sold by
Five Ten Georgia Iii Llc
Bought by
Csma Ft Llc and C/O First Key Mtg Llc
Current Estimated Value
Purchase Details
Closed on
Mar 20, 2014
Sold by
Mccullough Michelle A
Bought by
Five Ten Georgia Iii Llc
Purchase Details
Closed on
Jul 14, 2009
Sold by
Mccullough Travis Lamar
Bought by
Mccullough Michelle A
Purchase Details
Closed on
Mar 19, 1996
Sold by
Loggins Laurie
Bought by
Mccullough Travis Lamar Miche and Lle
Purchase Details
Closed on
Mar 25, 1993
Sold by
Stanley Samuel E and Stanley Allison M
Bought by
Loggins Byron M and Loggins Laurie A
Home Financials for this Owner
Home Financials are based on the most recent Mortgage that was taken out on this home.
Original Mortgage
$58,195
Interest Rate
7.7%
Mortgage Type
FHA
Create a Home Valuation Report for This Property
The Home Valuation Report is an in-depth analysis detailing your home's value as well as a comparison with similar homes in the area
Home Values in the Area
Average Home Value in this Area
Purchase History
| Date | Buyer | Sale Price | Title Company |
|---|---|---|---|
| Csma Ft Llc | $5,662,189 | -- | |
| Five Ten Georgia Iii Llc | $97,000 | -- | |
| Mccullough Michelle A | -- | -- | |
| Mccullough Travis Lamar Miche | $66,500 | -- | |
| Loggins Byron M | $59,000 | -- |
Source: Public Records
Mortgage History
| Date | Status | Borrower | Loan Amount |
|---|---|---|---|
| Previous Owner | Loggins Byron M | $58,195 | |
| Closed | Mccullough Travis Lamar Miche | $0 |
Source: Public Records
Tax History Compared to Growth
Tax History
| Year | Tax Paid | Tax Assessment Tax Assessment Total Assessment is a certain percentage of the fair market value that is determined by local assessors to be the total taxable value of land and additions on the property. | Land | Improvement |
|---|---|---|---|---|
| 2024 | $2,364 | $92,800 | $14,320 | $78,480 |
| 2023 | $2,294 | $89,960 | $13,040 | $76,920 |
| 2022 | $1,925 | $71,920 | $12,520 | $59,400 |
| 2021 | $1,604 | $58,320 | $7,160 | $51,160 |
| 2020 | $1,462 | $51,400 | $5,720 | $45,680 |
| 2019 | $1,401 | $48,680 | $6,040 | $42,640 |
| 2018 | $1,242 | $41,440 | $6,040 | $35,400 |
| 2017 | $1,101 | $36,840 | $6,040 | $30,800 |
| 2016 | $1,076 | $36,840 | $6,040 | $30,800 |
| 2015 | $795 | $32,480 | $6,040 | $26,440 |
| 2014 | $795 | $26,280 | $6,040 | $20,240 |
Source: Public Records
Map
Nearby Homes
- 4003 Warren Rd
- 3979 Alderstone Dr
- 3987 Alderstone Dr
- 3983 Alderstone Dr
- 4042 Alderstone Dr
- 4046 Alderstone Dr
- 4050 Alderstone Dr
- 4054 Alderstone Dr
- 3963 Alderstone Dr
- 4021 Laurant Path
- 4013 Laurant Path
- Wakehurst Plan at Falls Creek
- 3935 Alderstone Dr
- Sheridan Plan at Falls Creek
- Avera Plan at Falls Creek
- Atwood Plan at Falls Creek
- Trenton Plan at Falls Creek
- Prescott Plan at Falls Creek
- Ingram Plan at Falls Creek
- Fairfield Plan at Falls Creek
- 4030 Warren Rd Unit 4030
- 4030 Warren Rd
- 4034 Warren Rd Unit 1
- 4026 Warren Rd Unit 1
- 4038 Warren Rd
- 4022 Warren Rd Unit 1
- 4042 Warren Rd
- 4018 Warren Rd
- 4027 Warren Rd
- 4046 Warren Rd Unit 1
- 4014 Warren Rd
- 4031 Warren Rd
- 4021 Warren Rd
- 4050 Warren Rd
- 4010 Warren Rd
- 1001 Bridle Creek Dr
- 4054 Warren Rd
- 4015 Warren Rd
- 4035 Warren Rd
- 4006 Warren Rd