
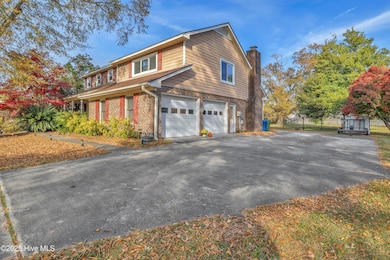
4031 Appleton Way Wilmington, NC 28412
Echo Farms-Rivers Edge NeighborhoodEstimated payment $2,947/month
Highlights
- 0.62 Acre Lot
- Sun or Florida Room
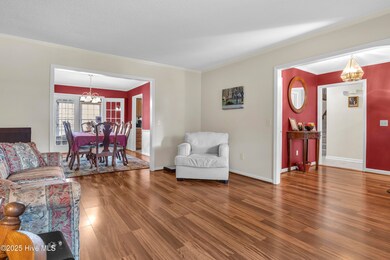
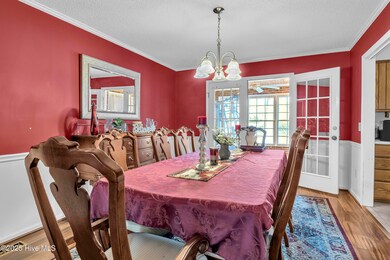
- Formal Dining Room
- Deck
- No HOA
- Fenced Yard
About This Home
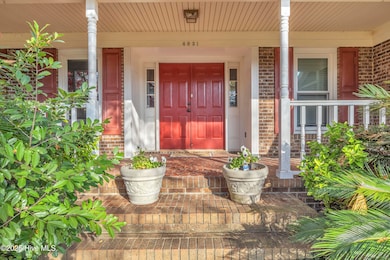
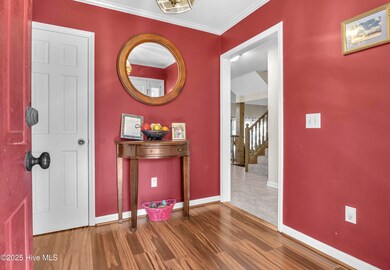
Opportunity meets location with this large 2-story home in the popular Echo Farms neighborhood. With over 2,850 square feet, and a large lot of well over 0.5 acres, you won't believe you are right in town, close to all the shopping, entertainment, and in a neighborhood with NO HOA. The spacious floorplan allows for a lot of flexibility with two bedrooms that have an en suite bathroom. The current owners have taken on the heavy lifting on updates like the roof in 2021, HVAC in 2021, new lining in the crawlspace in 2024 and most windows in 2025, along with new carpet and paint upstairs. The primary bathroom upstairs as well as the full bathroom upstairs have also been updated. Easily extend your gatherings to the outdoors with the front rocking porch, large sized deck on the back, and enclosed sunroom. The backyard is fully fenced in, and the home comes with a spacious 2-car garage. Echo Farms offers amenities like walking trails, playground, and a kayak launch. A swimming pool, and tennis / pickle-ball courts are right in the neighborhood at Echo Farms Park (managed through the city and entrance fees apply). Open enrollment in schools outside the district may be an option for buyers; please verify all enrollment possibilities independently.Please allow 24-hours notice for showings to interested and serious buyers. Remaining updates needed have been reflected in the pricing. Property is sold AS IS.
Listing Agent
Berkshire Hathaway HomeServices Carolina Premier Properties License #349514 Listed on: 12/28/2024

Home Details
Home Type
- Single Family
Est. Annual Taxes
- $2,834
Year Built
- Built in 1986
Lot Details
- 0.62 Acre Lot
- Fenced Yard
- Wood Fence
- Decorative Fence
- Property is zoned R-15
Home Design
- Brick Exterior Construction
- Wood Frame Construction
- Shingle Roof
- Shake Siding
- Stick Built Home
Interior Spaces
- 2,874 Sq Ft Home
- 2-Story Property
- Blinds
- Family Room
- Formal Dining Room
- Sun or Florida Room
- Crawl Space
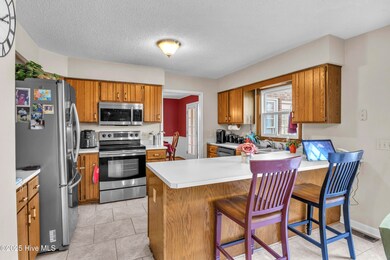
Kitchen
- Range
- Dishwasher
Flooring
- Carpet
- Laminate
- Tile
Bedrooms and Bathrooms
- 4 Bedrooms
- Walk-in Shower
Parking
- 2 Car Attached Garage
- Side Facing Garage
- Driveway
Outdoor Features
- Deck
- Porch
Schools
- Alderman Elementary School
- Williston Middle School
- New Hanover High School
Utilities
- Forced Air Heating System
- Electric Water Heater
- Municipal Trash
Community Details
- No Home Owners Association
- Echo Farms Subdivision
Listing and Financial Details
- Assessor Parcel Number R07011-003-016-000
Map
Home Values in the Area
Average Home Value in this Area
Tax History
| Year | Tax Paid | Tax Assessment Tax Assessment Total Assessment is a certain percentage of the fair market value that is determined by local assessors to be the total taxable value of land and additions on the property. | Land | Improvement |
|---|---|---|---|---|
| 2025 | $2,834 | $470,700 | $108,800 | $361,900 |
| 2024 | $2,834 | $325,700 | $87,700 | $238,000 |
| 2023 | $2,834 | $325,700 | $87,700 | $238,000 |
| 2022 | $2,768 | $325,700 | $87,700 | $238,000 |
| 2021 | $2,787 | $325,700 | $87,700 | $238,000 |
| 2020 | $3,203 | $304,100 | $74,200 | $229,900 |
| 2019 | $3,203 | $304,100 | $74,200 | $229,900 |
| 2018 | $3,203 | $304,100 | $74,200 | $229,900 |
| 2017 | $3,203 | $304,100 | $74,200 | $229,900 |
| 2016 | $3,121 | $281,700 | $74,200 | $207,500 |
| 2015 | $2,983 | $281,700 | $74,200 | $207,500 |
| 2014 | $2,856 | $281,700 | $74,200 | $207,500 |
Property History
| Date | Event | Price | List to Sale | Price per Sq Ft |
|---|---|---|---|---|
| 11/24/2025 11/24/25 | Price Changed | $515,000 | 0.0% | $179 / Sq Ft |
| 11/24/2025 11/24/25 | For Sale | $515,000 | -2.8% | $179 / Sq Ft |
| 02/05/2025 02/05/25 | Off Market | $530,000 | -- | -- |
| 12/28/2024 12/28/24 | For Sale | $530,000 | -- | $184 / Sq Ft |
Purchase History
| Date | Type | Sale Price | Title Company |
|---|---|---|---|
| Deed | $223,500 | -- | |
| Deed | $227,000 | -- | |
| Deed | $153,000 | -- | |
| Deed | $145,000 | -- | |
| Deed | -- | -- | |
| Deed | $30,000 | -- | |
| Deed | -- | -- | |
| Deed | $340,000 | -- | |
| Deed | -- | -- | |
| Deed | $1,000,000 | -- | |
| Deed | -- | -- |
Source: Hive MLS
MLS Number: 100480579
APN: R07011-003-016-000
Disclaimer: Certain information contained herein is derived from information provided by parties other than Homes.com. All information provided is deemed reliable, but is not guaranteed to be accurate and should be independently verified.
![]() The data relating to real estate on this web site comes in part from the Internet Data Exchange program of Hive MLS LLC. All information is deemed reliable but not guaranteed and should be independently verified. All properties are subject to prior sale, change, or withdrawal. Neither listing broker(s) nor Homesnap, Inc. shall be responsible for any typographical errors, misinformation, or misprints, and shall be held totally harmless from any damages arising from reliance upon these data. ©2025 Hive MLS LLC
The data relating to real estate on this web site comes in part from the Internet Data Exchange program of Hive MLS LLC. All information is deemed reliable but not guaranteed and should be independently verified. All properties are subject to prior sale, change, or withdrawal. Neither listing broker(s) nor Homesnap, Inc. shall be responsible for any typographical errors, misinformation, or misprints, and shall be held totally harmless from any damages arising from reliance upon these data. ©2025 Hive MLS LLC
- 1014 Mccarley Blvd
- 1114 Mccarley Blvd
- 3628 Daufuskie Dr
- 4325 Appleton Way
- 4326 Peeble Dr
- 4246 Appleton Way
- 4113 Rounding Bend Ln
- 324 Wimbledon Ct
- 4432 Regent Dr
- 4158 Breezewood Dr Unit 203
- 3124 Laughing Gull Terrace
- 1006 Ryans Ct
- 4024 Rounding Bend Ln
- 4314 Jonathan Ct
- 3721 Sand Trap Ct
- 4156 Breezewood Dr Unit 102
- 4166 Breezewood Dr Unit 103
- 1008 Shallowford Dr
- 305 Saint Annes Moor
- 1137 Island Cove
- 3612 Beverly Cove Way
- 3215 Midvale Dr
- 4605 Fairview Dr
- 910 Coosaw Place
- 4162 Breezewood Dr Unit 202
- 986 Coosaw Place
- 830 Coosaw Place
- 828 Coosaw Place
- 837 Coosaw Place
- 3998 Echo Farms Blvd
- 1144 Island Cove
- 2440 Salinger Ct
- 821 Coosaw Place
- 4146 Breezewood Dr Unit F/202
- 1109 Matteo Dr
- 3810 Portofino Ct
- 217 Windchime Dr
- 1108 St Andrews Dr
- 3960 Independence Blvd
- 234 Hibiscus Way