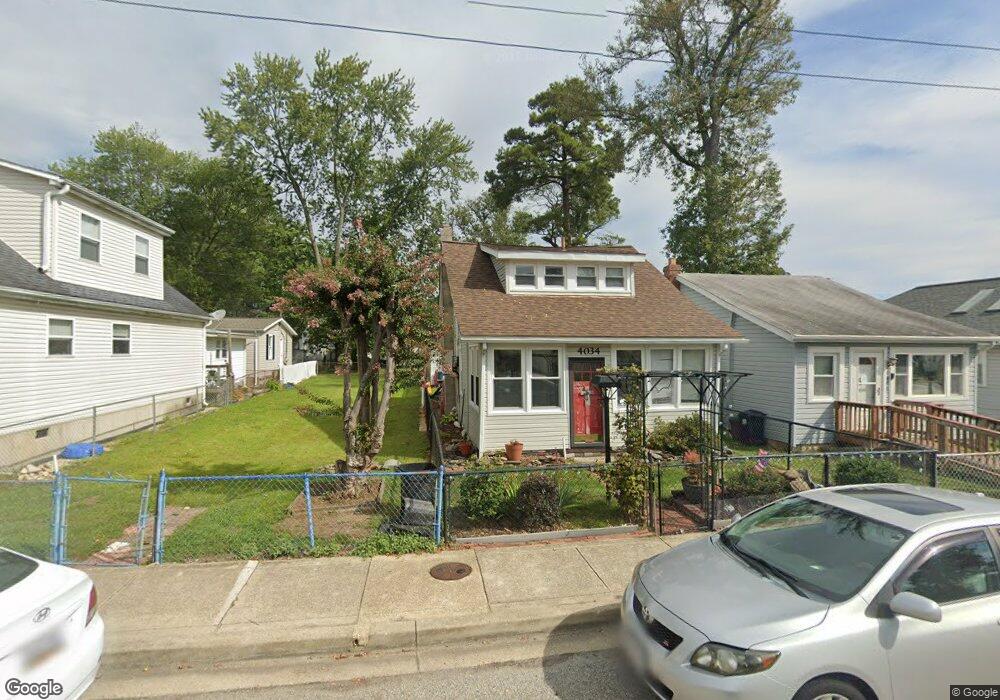
4032 8th St North Beach, MD 20714
Estimated Value: $251,343 - $346,000
Studio
1
Bath
882
Sq Ft
$345/Sq Ft
Est. Value
About This Home
This home is located at 4032 8th St, North Beach, MD 20714 and is currently estimated at $304,336, approximately $345 per square foot. 4032 8th St is a home located in Calvert County with nearby schools including Windy Hill Elementary School, Windy Hill Middle School, and Northern High School.
Ownership History
Date
Name
Owned For
Owner Type
Purchase Details
Closed on
Mar 7, 2018
Sold by
United States Of America
Bought by
The Town Of North Beach
Current Estimated Value
Purchase Details
Closed on
Sep 6, 1996
Sold by
Johns Jean M
Bought by
Abell James K
Purchase Details
Closed on
Apr 14, 1989
Sold by
Cameron Jean
Bought by
Johns Jean M
Home Financials for this Owner
Home Financials are based on the most recent Mortgage that was taken out on this home.
Original Mortgage
$65,000
Interest Rate
11.11%
Purchase Details
Closed on
Jun 6, 1984
Sold by
Barta Mabel V
Bought by
Cameron Jean
Home Financials for this Owner
Home Financials are based on the most recent Mortgage that was taken out on this home.
Original Mortgage
$36,100
Interest Rate
14.29%
Create a Home Valuation Report for This Property
The Home Valuation Report is an in-depth analysis detailing your home's value as well as a comparison with similar homes in the area
Home Values in the Area
Average Home Value in this Area
Purchase History
| Date | Buyer | Sale Price | Title Company |
|---|---|---|---|
| The Town Of North Beach | -- | None Available | |
| Abell James K | $85,600 | -- | |
| Johns Jean M | $65,000 | -- | |
| Cameron Jean | $38,000 | -- |
Source: Public Records
Mortgage History
| Date | Status | Borrower | Loan Amount |
|---|---|---|---|
| Previous Owner | Johns Jean M | $65,000 | |
| Previous Owner | Cameron Jean | $36,100 | |
| Closed | Abell James K | -- |
Source: Public Records
Tax History
| Year | Tax Paid | Tax Assessment Tax Assessment Total Assessment is a certain percentage of the fair market value that is determined by local assessors to be the total taxable value of land and additions on the property. | Land | Improvement |
|---|---|---|---|---|
| 2025 | $162 | $172,000 | $82,400 | $89,600 |
| 2024 | $157 | $164,833 | $0 | $0 |
| 2023 | $154 | $157,667 | $0 | $0 |
| 2022 | $151 | $150,500 | $82,400 | $68,100 |
| 2021 | $151 | $149,367 | $0 | $0 |
| 2020 | $145 | $148,233 | $0 | $0 |
| 2019 | $1,980 | $147,100 | $82,400 | $64,700 |
| 2018 | $1,963 | $145,867 | $0 | $0 |
| 2017 | $2,700 | $144,633 | $0 | $0 |
| 2016 | -- | $143,400 | $0 | $0 |
| 2015 | $2,646 | $143,400 | $0 | $0 |
| 2014 | $2,646 | $143,400 | $0 | $0 |
Source: Public Records
Map
Nearby Homes
- 4149 9th St
- 9538 Sea Gull Ct
- 9000 Bay Ave Unit 401 & 402
- 9101 Greenwood Ave
- 9000 Frederick Ave
- 3813 8th St
- 3905 2nd St
- 3761 Bedford Dr
- 3611 7th St
- 700 Maple Ave
- 3645 Bedford Dr
- 8986 Chesapeake Lighthouse Dr
- 8734 Chesapeake Lighthouse Dr
- 3617 30th St
- 3709 29th St
- 3800 28th St
- 8401 F St
- 7037 Dover Ave
- 8229 Bayside Rd
- 900 Walnut Ave
Your Personal Tour Guide
Ask me questions while you tour the home.