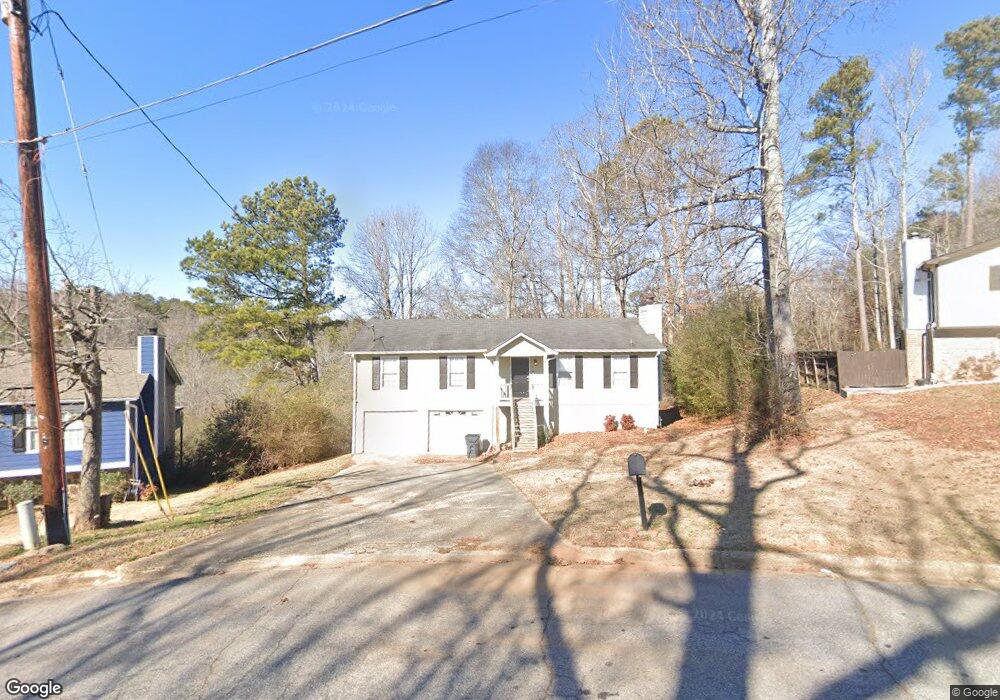
4032 Cindy Dr Douglasville, GA 30135
Estimated Value: $239,000 - $252,000
3
Beds
2
Baths
1,472
Sq Ft
$167/Sq Ft
Est. Value
About This Home
This home is located at 4032 Cindy Dr, Douglasville, GA 30135 and is currently estimated at $245,410, approximately $166 per square foot. 4032 Cindy Dr is a home located in Douglas County with nearby schools including Mt. Carmel Elementary School, Chestnut Log Middle School, and New Manchester High School.
Ownership History
Date
Name
Owned For
Owner Type
Purchase Details
Closed on
Aug 5, 2021
Sold by
Progress Atlanta Llc
Bought by
Progress Residential Borrower 17 Llc
Current Estimated Value
Purchase Details
Closed on
Mar 24, 2021
Sold by
Cosner Lita L
Bought by
Progress Atlanta Llc
Purchase Details
Closed on
Jul 12, 2019
Sold by
Euliano Meghan V
Bought by
Cosner Lita L
Home Financials for this Owner
Home Financials are based on the most recent Mortgage that was taken out on this home.
Original Mortgage
$118,979
Interest Rate
4.37%
Mortgage Type
FHA
Purchase Details
Closed on
Aug 30, 2013
Sold by
Hertlen Edward O
Bought by
Mayercik Megan
Home Financials for this Owner
Home Financials are based on the most recent Mortgage that was taken out on this home.
Original Mortgage
$75,255
Interest Rate
4.37%
Mortgage Type
New Conventional
Purchase Details
Closed on
May 1, 2007
Sold by
Marti Sharon
Bought by
Suntrust Mortgage Inc
Create a Home Valuation Report for This Property
The Home Valuation Report is an in-depth analysis detailing your home's value as well as a comparison with similar homes in the area
Home Values in the Area
Average Home Value in this Area
Purchase History
| Date | Buyer | Sale Price | Title Company |
|---|---|---|---|
| Progress Residential Borrower 17 Llc | -- | -- | |
| Progress Atlanta Llc | $175,000 | -- | |
| Cosner Lita L | $125,000 | -- | |
| Mayercik Megan | $79,900 | -- | |
| Suntrust Mortgage Inc | $88,609 | -- |
Source: Public Records
Mortgage History
| Date | Status | Borrower | Loan Amount |
|---|---|---|---|
| Previous Owner | Cosner Lita L | $118,979 | |
| Previous Owner | Mayercik Megan | $75,255 |
Source: Public Records
Tax History Compared to Growth
Tax History
| Year | Tax Paid | Tax Assessment Tax Assessment Total Assessment is a certain percentage of the fair market value that is determined by local assessors to be the total taxable value of land and additions on the property. | Land | Improvement |
|---|---|---|---|---|
| 2024 | $3,584 | $86,240 | $19,040 | $67,200 |
| 2023 | $3,584 | $86,240 | $19,040 | $67,200 |
| 2022 | $2,630 | $64,840 | $11,200 | $53,640 |
| 2021 | $2,051 | $50,360 | $12,200 | $38,160 |
| 2020 | $1,666 | $40,160 | $9,720 | $30,440 |
| 2019 | $1,531 | $38,960 | $9,720 | $29,240 |
| 2018 | $1,315 | $33,240 | $8,480 | $24,760 |
| 2017 | $1,313 | $32,840 | $9,280 | $23,560 |
| 2016 | $812 | $19,960 | $6,220 | $13,740 |
| 2015 | $804 | $21,820 | $6,800 | $15,020 |
| 2014 | $746 | $20,916 | $6,920 | $13,996 |
| 2013 | -- | $21,356 | $7,160 | $14,196 |
Source: Public Records
Map
Nearby Homes
- 2627 Carol Cir
- 2539 Slater Mill Rd
- 2529 Slater Mill Rd
- 0 Slater Mill Rd Unit 7591224
- 0 Slater Mill Rd Unit 10535776
- 2519 Slater Mill Rd
- 2509 Slater Mill Rd
- 2499 Slater Mill Rd
- 3825 Bentley Dr
- 4155 Prestley Mill Rd
- 3811 Paul St
- 5260 Prestley Crossing Ln
- 3159 W Point Cir
- 5264 Prestley Crossing Ln
- 0 Presley Place Unit 9066983
- 5326 Presley Place
- 1604 Haven Cir
- 4912 Saint Johns Dr
- 4000 Landmark Dr
- 3721 Longview Dr