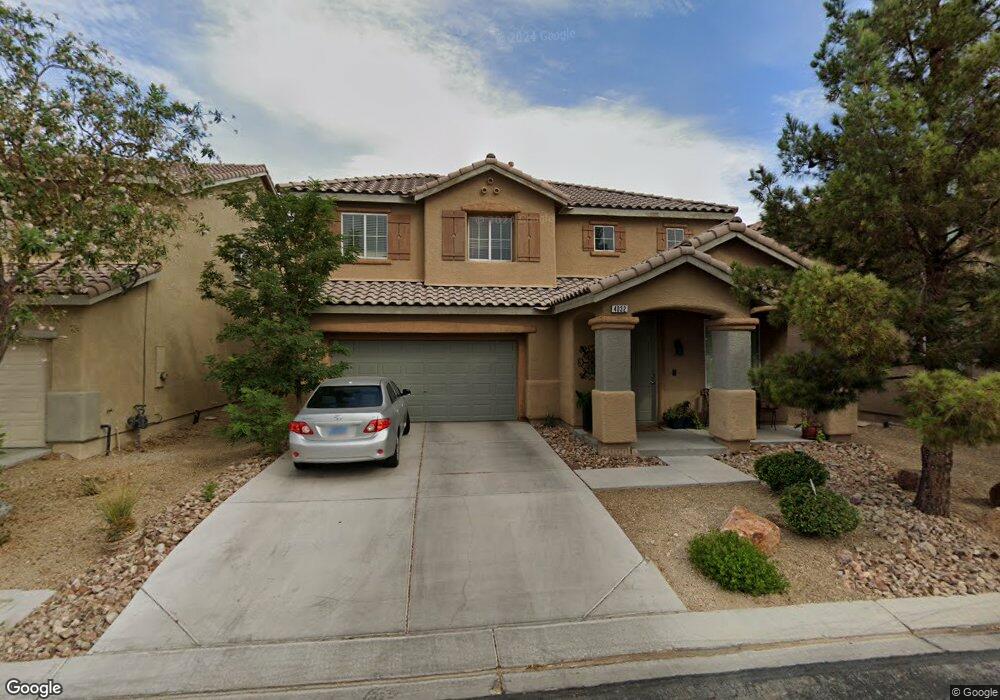
4032 Little Bend Ln North Las Vegas, NV 89081
Northridge NeighborhoodEstimated Value: $449,000 - $495,000
6
Beds
4
Baths
2,614
Sq Ft
$180/Sq Ft
Est. Value
About This Home
This home is located at 4032 Little Bend Ln, North Las Vegas, NV 89081 and is currently estimated at $469,951, approximately $179 per square foot. 4032 Little Bend Ln is a home located in Clark County with nearby schools including D.L. Dusty Dickens Elementary School, Clifford O. Findlay Middle School, and Mojave High School.
Ownership History
Date
Name
Owned For
Owner Type
Purchase Details
Closed on
Mar 30, 2011
Sold by
Federal Home Loan Mortgage Corporation
Bought by
Campos Sandra
Current Estimated Value
Home Financials for this Owner
Home Financials are based on the most recent Mortgage that was taken out on this home.
Original Mortgage
$143,273
Interest Rate
4.84%
Mortgage Type
FHA
Purchase Details
Closed on
Nov 10, 2010
Sold by
Padilla Jair
Bought by
Federal Home Loan Mortgage Corporation
Purchase Details
Closed on
Dec 31, 2007
Sold by
Richmond American Homes Of Nevada Inc
Bought by
Padilla Jair
Home Financials for this Owner
Home Financials are based on the most recent Mortgage that was taken out on this home.
Original Mortgage
$224,190
Interest Rate
6.15%
Mortgage Type
Unknown
Create a Home Valuation Report for This Property
The Home Valuation Report is an in-depth analysis detailing your home's value as well as a comparison with similar homes in the area
Home Values in the Area
Average Home Value in this Area
Purchase History
| Date | Buyer | Sale Price | Title Company |
|---|---|---|---|
| Campos Sandra | $147,000 | Lsi Title Agency Inc | |
| Federal Home Loan Mortgage Corporation | $118,400 | Accommodation | |
| Padilla Jair | $235,990 | Stewart Title |
Source: Public Records
Mortgage History
| Date | Status | Borrower | Loan Amount |
|---|---|---|---|
| Previous Owner | Campos Sandra | $143,273 | |
| Previous Owner | Padilla Jair | $224,190 |
Source: Public Records
Tax History Compared to Growth
Tax History
| Year | Tax Paid | Tax Assessment Tax Assessment Total Assessment is a certain percentage of the fair market value that is determined by local assessors to be the total taxable value of land and additions on the property. | Land | Improvement |
|---|---|---|---|---|
| 2025 | $2,279 | $151,932 | $36,050 | $115,882 |
| 2024 | $2,213 | $151,932 | $36,050 | $115,882 |
| 2023 | $1,694 | $144,982 | $35,700 | $109,282 |
| 2022 | $2,356 | $119,656 | $29,050 | $90,606 |
| 2021 | $2,182 | $105,604 | $26,250 | $79,354 |
| 2020 | $2,023 | $97,109 | $26,250 | $70,859 |
| 2019 | $1,896 | $97,545 | $23,450 | $74,095 |
| 2018 | $1,809 | $86,646 | $19,250 | $67,396 |
| 2017 | $2,839 | $84,631 | $18,200 | $66,431 |
| 2016 | $1,694 | $88,229 | $15,050 | $73,179 |
| 2015 | $1,690 | $63,182 | $10,500 | $52,682 |
| 2014 | $1,637 | $50,103 | $7,700 | $42,403 |
Source: Public Records
Map
Nearby Homes
- 4013 Villa Serena Ln
- 4016 Mills Bay Ln
- 3912 Makushin Bay Ave
- 5829 Petrified Tree Ln
- 5852 Clear Haven Ln
- 5844 Delaney Falls St
- 5905 Middle Rock St
- 5856 Country Lake Ln
- 4204 Seclusion Bay Ave
- 4104 Free Bird Crest Ave
- 4205 Zilker Park Ave
- 4209 Zilker Park Ave
- 3813 Jasmine Heights Ave Unit 4F
- 4200 Zilker Park Ave
- 5945 Violet Crown St
- 4112 Carol Bailey Ave
- Plan 2784 at Briscoe
- Plan 2333 Modeled at Briscoe
- Plan 2175 at Briscoe
- Plan 1453 Modeled at Briscoe
- 4036 Little Bend Ln
- 4028 Little Bend Ln
- 4040 Little Bend Ln
- 4024 Little Bend Ln
- 4033 Villa Serena Ln
- 4033 Villa Serena Ln
- 4029 Villa Serena Ln
- 4037 Villa Serena Ln
- 4025 Villa Serena Ln
- 4041 Villa Serena Ln
- 4020 Little Bend Ln
- 4044 Little Bend Ln
- 4021 Villa Serena Ln
- 4045 Villa Serena Ln
- 4016 Little Bend Ln
- 4017 Villa Serena Ln
- 4032 Villa Serena Ln
- 4028 Villa Serena Ln
- 4036 Villa Serena Ln
- 4012 Little Bend Ln