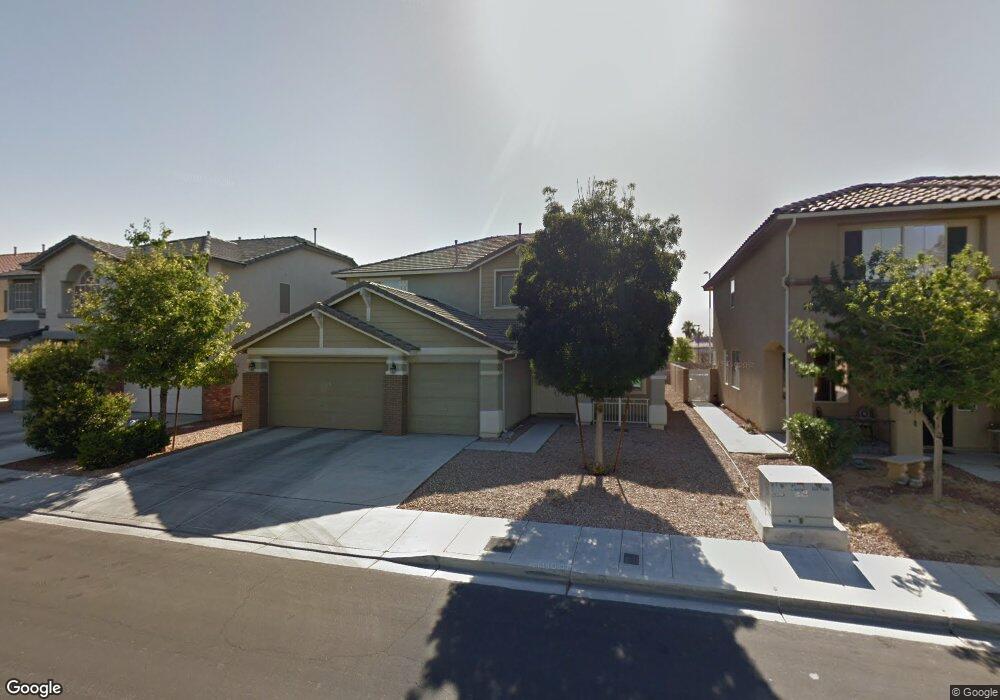
4032 Perfect Lure St Unit 5 Las Vegas, NV 89129
Lone Mountain NeighborhoodEstimated Value: $589,713 - $641,000
5
Beds
4
Baths
3,320
Sq Ft
$188/Sq Ft
Est. Value
About This Home
This home is located at 4032 Perfect Lure St Unit 5, Las Vegas, NV 89129 and is currently estimated at $622,678, approximately $187 per square foot. 4032 Perfect Lure St Unit 5 is a home located in Clark County with nearby schools including Ruthe Deskin Elementary School, Justice Myron E Leavitt Middle School, and Centennial High School.
Ownership History
Date
Name
Owned For
Owner Type
Purchase Details
Closed on
Aug 31, 2011
Sold by
Sp01 Llc
Bought by
Efendi Bernard and Ho Liawaty
Current Estimated Value
Home Financials for this Owner
Home Financials are based on the most recent Mortgage that was taken out on this home.
Original Mortgage
$150,000
Interest Rate
4.46%
Mortgage Type
New Conventional
Purchase Details
Closed on
Mar 30, 2011
Sold by
Cortes Virgencita M
Bought by
Sp01 Llc
Purchase Details
Closed on
May 18, 2005
Sold by
Kb Home Nevada Inc
Bought by
Cortes Virgencita M
Home Financials for this Owner
Home Financials are based on the most recent Mortgage that was taken out on this home.
Original Mortgage
$373,750
Interest Rate
6.12%
Mortgage Type
New Conventional
Create a Home Valuation Report for This Property
The Home Valuation Report is an in-depth analysis detailing your home's value as well as a comparison with similar homes in the area
Home Values in the Area
Average Home Value in this Area
Purchase History
| Date | Buyer | Sale Price | Title Company |
|---|---|---|---|
| Efendi Bernard | $206,000 | National Title Company | |
| Sp01 Llc | $188,000 | None Available | |
| Cortes Virgencita M | $473,449 | First Amer Title Co Of Nv |
Source: Public Records
Mortgage History
| Date | Status | Borrower | Loan Amount |
|---|---|---|---|
| Closed | Efendi Bernard | $150,000 | |
| Previous Owner | Cortes Virgencita M | $373,750 | |
| Closed | Cortes Virgencita M | $47,300 |
Source: Public Records
Tax History Compared to Growth
Tax History
| Year | Tax Paid | Tax Assessment Tax Assessment Total Assessment is a certain percentage of the fair market value that is determined by local assessors to be the total taxable value of land and additions on the property. | Land | Improvement |
|---|---|---|---|---|
| 2025 | $2,884 | $167,036 | $46,550 | $120,486 |
| 2024 | $2,801 | $167,036 | $46,550 | $120,486 |
| 2023 | $2,801 | $161,896 | $47,950 | $113,946 |
| 2022 | $2,719 | $137,940 | $34,300 | $103,640 |
| 2021 | $2,640 | $130,720 | $32,200 | $98,520 |
| 2020 | $2,560 | $129,309 | $31,850 | $97,459 |
| 2019 | $2,529 | $123,794 | $28,000 | $95,794 |
| 2018 | $2,413 | $114,329 | $23,100 | $91,229 |
| 2017 | $3,396 | $103,581 | $22,400 | $81,181 |
| 2016 | $2,259 | $93,609 | $16,450 | $77,159 |
| 2015 | $2,255 | $72,211 | $14,350 | $57,861 |
| 2014 | $2,189 | $64,779 | $7,000 | $57,779 |
Source: Public Records
Map
Nearby Homes
- 7223 Hollywood Park Ave
- 4025 Cunning Fellow Ct
- 4061 Browndeer Cir
- 4025 Sea Hero St
- 4021 Sea Hero St Unit 1
- 4109 Glenfield Cir
- 4053 Hazelridge Dr
- 7251 Daily Double Ave
- 4224 Perfect Drift St
- 4205 Thunder Twice St
- 7408 Summer Crest Ln
- 4252 Olympic Point Dr
- 4052 Cape Sand Dr
- 7415 Constantinople Ave
- 3351 Dancing Waters St
- 3344 Dancing Waters St
- 3350 Dancing Waters St
- 4356 Perfect Drift St
- 7780 Hickam Ave
- 7349 Dolphine Crest Ave
- 4032 Perfect Lure St
- 4028 Perfect Lure St
- 4036 Perfect Lure St
- 4024 Perfect Lure St
- 4040 Perfect Lure St
- 4028 Cunning Fellow Ct
- 4020 Perfect Lure St
- 4044 Perfect Lure St
- 4024 Cunning Fellow Ct
- 4032 Cunning Fellow Ct
- 4020 Cunning Fellow Ct
- 4037 Browndeer Cir
- 4033 Browndeer Cir
- 4041 Browndeer Cir
- 4048 Perfect Lure St
- 4016 Cunning Fellow Ct Unit 3
- 4045 Browndeer Cir
- 7229 Hollywood Park Ave
- 4012 Perfect Lure St
- 4049 N Browndeer Cir