Estimated Value: $566,000 - $762,000
4
Beds
3
Baths
3,449
Sq Ft
$198/Sq Ft
Est. Value
About This Home
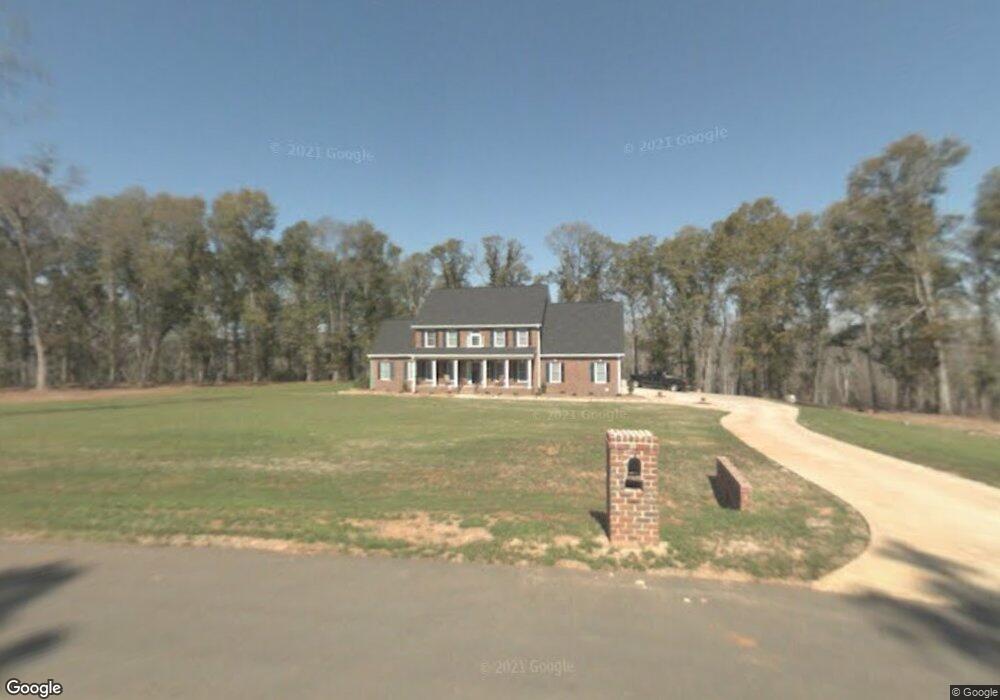
This home is located at 4032 Roundtop Cir, Perry, GA 31069 and is currently estimated at $684,175, approximately $198 per square foot. 4032 Roundtop Cir is a home located in Houston County with nearby schools including Tucker Elementary School, Perry Middle School, and Perry High School.
Ownership History
Date
Name
Owned For
Owner Type
Purchase Details
Closed on
Jun 11, 2007
Sold by
Carter Wilkes Construction Inc
Bought by
Mclean Henry S and Mclean Susan B
Current Estimated Value
Home Financials for this Owner
Home Financials are based on the most recent Mortgage that was taken out on this home.
Original Mortgage
$147,000
Outstanding Balance
$87,406
Interest Rate
6.12%
Mortgage Type
New Conventional
Estimated Equity
$596,769
Purchase Details
Closed on
Dec 18, 2006
Sold by
Planters First
Bought by
Orchard Development Llp
Home Financials for this Owner
Home Financials are based on the most recent Mortgage that was taken out on this home.
Original Mortgage
$356,000
Interest Rate
6.29%
Mortgage Type
Future Advance Clause Open End Mortgage
Purchase Details
Closed on
Dec 12, 2006
Sold by
Orchard Developments Llp
Bought by
Carter Wilkes Construction Inc
Home Financials for this Owner
Home Financials are based on the most recent Mortgage that was taken out on this home.
Original Mortgage
$356,000
Interest Rate
6.29%
Mortgage Type
Future Advance Clause Open End Mortgage
Create a Home Valuation Report for This Property
The Home Valuation Report is an in-depth analysis detailing your home's value as well as a comparison with similar homes in the area
Purchase History
| Date | Buyer | Sale Price | Title Company |
|---|---|---|---|
| Mclean Henry S | $444,700 | None Available | |
| Orchard Development Llp | -- | None Available | |
| Carter Wilkes Construction Inc | $100,000 | None Available |
Source: Public Records
Mortgage History
| Date | Status | Borrower | Loan Amount |
|---|---|---|---|
| Open | Mclean Henry S | $147,000 | |
| Closed | Mclean Henry S | $100,000 | |
| Previous Owner | Carter Wilkes Construction Inc | $356,000 |
Source: Public Records
Tax History
| Year | Tax Paid | Tax Assessment Tax Assessment Total Assessment is a certain percentage of the fair market value that is determined by local assessors to be the total taxable value of land and additions on the property. | Land | Improvement |
|---|---|---|---|---|
| 2025 | $4,835 | $231,360 | $45,600 | $185,760 |
| 2024 | $5,072 | $214,040 | $30,720 | $183,320 |
| 2023 | $4,559 | $190,640 | $25,600 | $165,040 |
| 2022 | $4,376 | $183,040 | $25,600 | $157,440 |
| 2021 | $3,890 | $162,120 | $30,000 | $132,120 |
| 2020 | $3,904 | $161,960 | $19,800 | $142,160 |
| 2019 | $3,904 | $161,960 | $19,800 | $142,160 |
| 2018 | $3,904 | $161,960 | $19,800 | $142,160 |
| 2017 | $3,908 | $161,960 | $19,800 | $142,160 |
| 2016 | $3,914 | $161,960 | $19,800 | $142,160 |
| 2015 | $3,682 | $152,160 | $10,000 | $142,160 |
| 2014 | -- | $152,160 | $10,000 | $142,160 |
| 2013 | -- | $152,160 | $10,000 | $142,160 |
Source: Public Records
Map
Nearby Homes
- 2008 Potters Rd
- (5.41 acres) Redridge Ln
- Tract 10 Duke Rd
- 101 Creigh St
- 200 Felton Rd
- 213 Cattle Dr
- 215 Cattle Dr
- 311 Rusty Plow Ln
- 311 Rusty Plow Ln Unit 16
- 100 Planters Row Dr
- 211 Cattle Dr
- 202 Cattle Dr
- 208 Cattle Dr
- 307 Rusty Plow Ln
- 307 Rusty Plow Ln Unit 14
- 102 Scarecrow Ln
- 102 Mcewen Ct
- 305 Rusty Plow Ln
- 305 Rusty Plow Ln Unit 13
- 303 Rusty Plow Ln
- 4027 Roundtop Cir
- 4030 Roundtop Cir
- 4036 Roundtop Cir
- 4025 Roundtop Cir
- 4025 Roundtop Circle (Lot#66)
- 4000 Roundtop Cir
- 4028 Roundtop Cir
- 4029 Roundtop Circle (Lot#68)
- 4026 Roundtop Cir
- 4038 Roundtop Cir
- 4023 Roundtop Cir
- 4031 Roundtop Cir
- 4024 ROUNDTOP Circle
- 4024 Roundtop Cir
- 4040 Roundtop Cir
- 4033 Roundtop Cir
- 4021 Roundtop Cir
- 4022 Roundtop Cir
- 4035 Roundtop Cir
- 4042 Roundtop Cir
Your Personal Tour Guide
Ask me questions while you tour the home.