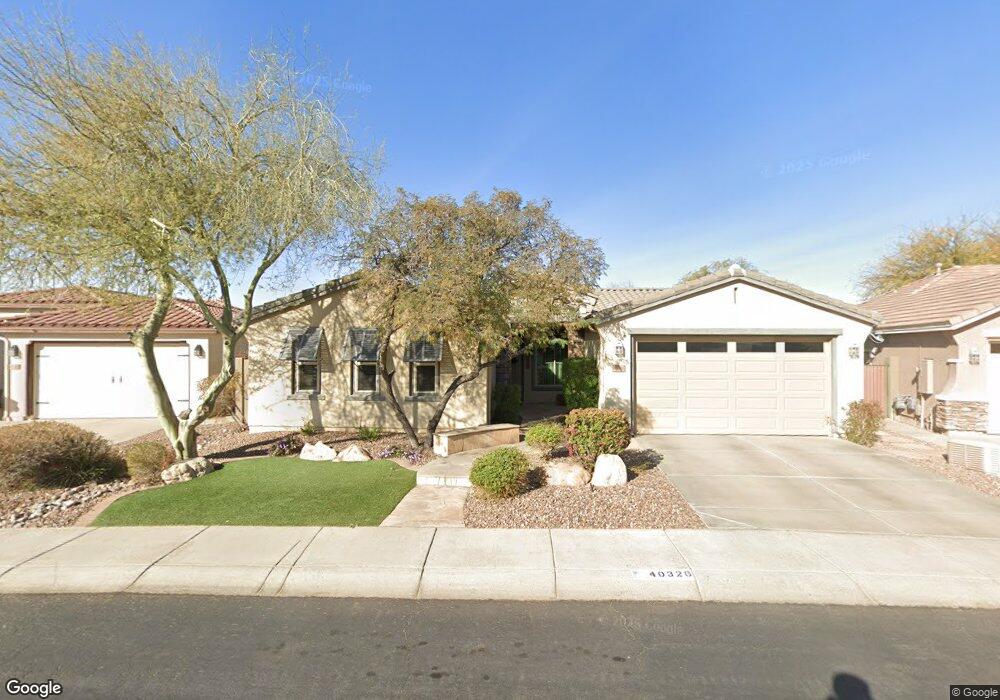
40326 N Exploration Trail Anthem, AZ 85086
Estimated Value: $515,202 - $568,000
3
Beds
2
Baths
2,490
Sq Ft
$221/Sq Ft
Est. Value
About This Home
This home is located at 40326 N Exploration Trail, Anthem, AZ 85086 and is currently estimated at $551,051, approximately $221 per square foot. 40326 N Exploration Trail is a home located in Maricopa County with nearby schools including Anthem School, Boulder Creek High School, and BASIS Phoenix North.
Ownership History
Date
Name
Owned For
Owner Type
Purchase Details
Closed on
Jul 25, 2017
Sold by
Senska Family Trust and Senska Edmund M
Bought by
Senska Properties Iii Llc and Senska Edmund M
Current Estimated Value
Purchase Details
Closed on
Apr 2, 2003
Sold by
Senska Edmund M and Senska Margaret A
Bought by
Senska Edmund M and Senska Margaret A
Home Financials for this Owner
Home Financials are based on the most recent Mortgage that was taken out on this home.
Original Mortgage
$176,500
Interest Rate
5.78%
Purchase Details
Closed on
Jul 2, 2001
Sold by
Senska Edmund M and Senska Margaret A
Bought by
Senska Edmund M and Senska Margaret A
Purchase Details
Closed on
Jul 7, 2000
Sold by
Del Webbs Coventry Homes Inc
Bought by
Senska Edmund M and Senska Margaret A
Home Financials for this Owner
Home Financials are based on the most recent Mortgage that was taken out on this home.
Original Mortgage
$208,863
Interest Rate
7.87%
Mortgage Type
New Conventional
Purchase Details
Closed on
Mar 15, 2000
Sold by
Anthem Arizona Llc
Bought by
Del Webbs Coventry Homes Inc
Create a Home Valuation Report for This Property
The Home Valuation Report is an in-depth analysis detailing your home's value as well as a comparison with similar homes in the area
Home Values in the Area
Average Home Value in this Area
Purchase History
| Date | Buyer | Sale Price | Title Company |
|---|---|---|---|
| Senska Properties Iii Llc | -- | None Available | |
| Senska Edmund M | -- | Fidelity National Title | |
| Senska Edmund M | -- | Fidelity National Title | |
| Senska Edmund M | -- | Title Guaranty Agency | |
| Senska Edmund M | $219,863 | First American Title | |
| Del Webbs Coventry Homes Inc | -- | First American Title |
Source: Public Records
Mortgage History
| Date | Status | Borrower | Loan Amount |
|---|---|---|---|
| Previous Owner | Senska Edmund M | $176,500 | |
| Previous Owner | Senska Edmund M | $208,863 |
Source: Public Records
Tax History Compared to Growth
Tax History
| Year | Tax Paid | Tax Assessment Tax Assessment Total Assessment is a certain percentage of the fair market value that is determined by local assessors to be the total taxable value of land and additions on the property. | Land | Improvement |
|---|---|---|---|---|
| 2025 | $2,608 | $29,575 | -- | -- |
| 2024 | $2,987 | $28,167 | -- | -- |
| 2023 | $2,987 | $41,470 | $8,290 | $33,180 |
| 2022 | $2,855 | $30,460 | $6,090 | $24,370 |
| 2021 | $2,940 | $28,400 | $5,680 | $22,720 |
| 2020 | $2,875 | $26,810 | $5,360 | $21,450 |
| 2019 | $3,215 | $25,800 | $5,160 | $20,640 |
| 2018 | $3,122 | $24,450 | $4,890 | $19,560 |
| 2017 | $3,060 | $23,730 | $4,740 | $18,990 |
| 2016 | $2,296 | $22,670 | $4,530 | $18,140 |
| 2015 | $2,228 | $22,250 | $4,450 | $17,800 |
Source: Public Records
Map
Nearby Homes
- 40128 N Integrity Trail
- 3437 W Walden Way
- 40015 N Pride Dr
- 3544 W Twain Dr
- 3546 W Webster Ct Unit 6
- 3422 W King Dr
- 3336 W King Dr Unit 9
- 40915 N Columbia Trail
- 40711 N Ericson Ln
- 39733 N Wisdom Way
- 3723 W Memorial Dr
- 3051 W Sousa Ct
- 3135 W Kuralt Ct
- 3747 W Memorial Dr Unit 67
- 40701 N Union Trail
- 3033 W Keller Dr
- 40924 N Crockett Trail
- 3629 W Amerigo Ct Unit 41B
- 3283 W Mesquite St
- 3737 W Medinah Way
- 40332 N Exploration Trail
- 40320 N Exploration Trail
- 40314 N Exploration Trail
- 40338 N Exploration Trail
- 40325 N Exploration Trail
- 40317 N Exploration Trail
- 40337 N Exploration Trail
- 40308 N Exploration Trail
- 40309 N Exploration Trail
- 40404 N Exploration Trail Unit 7
- 3367 W Owens Way
- 3363 W Owens Way
- 40218 N Integrity Trail
- 40301 N Exploration Trail
- 40410 N Exploration Trail
- 1200 N Territory Trail
- 3414 W Morse Dr Unit 7
- 40317 N National Trail
- 40311 N National Trail Unit 6
- 3359 W Owens Way