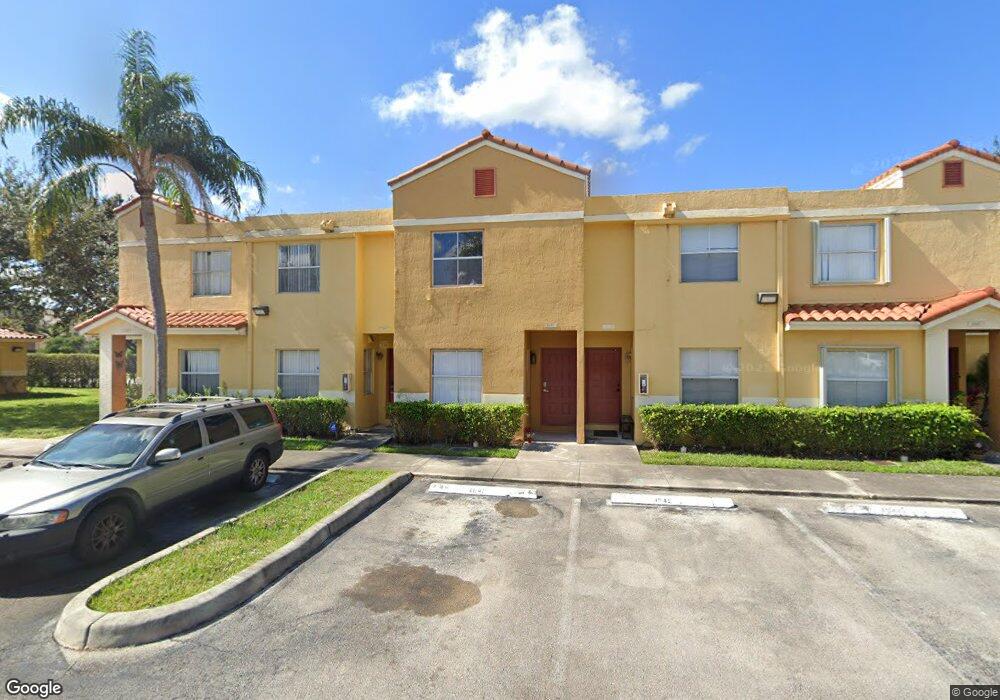
4033 NW 90th Ave Unit 4033 Sunrise, FL 33351
Spring Tree NeighborhoodEstimated Value: $262,000 - $306,911
4
Beds
2
Baths
1,100
Sq Ft
$266/Sq Ft
Est. Value
About This Home
This home is located at 4033 NW 90th Ave Unit 4033, Sunrise, FL 33351 and is currently estimated at $292,728, approximately $266 per square foot. 4033 NW 90th Ave Unit 4033 is a home located in Broward County with nearby schools including Welleby Elementary School, Westpine Middle School, and Piper High School.
Ownership History
Date
Name
Owned For
Owner Type
Purchase Details
Closed on
Nov 17, 2021
Sold by
Puentes Sandra
Bought by
Sasamajo Inc
Current Estimated Value
Purchase Details
Closed on
Jul 30, 2015
Sold by
Hwang Jeanping and Hwang Sheyming
Bought by
Puentes Sandra
Purchase Details
Closed on
Oct 16, 2013
Sold by
Aphis Investment Llc
Bought by
Hwang Jeanping and Hwang Sheyming
Purchase Details
Closed on
Feb 10, 2009
Sold by
The Bank Of New York Mellon
Bought by
Aphis Investment Llc
Purchase Details
Closed on
Sep 9, 2008
Sold by
Serrano Ivon
Bought by
The Bank Of New York Mellon
Purchase Details
Closed on
Sep 29, 2005
Sold by
Sunrise Point Village Llc
Bought by
Serrano Ivon
Home Financials for this Owner
Home Financials are based on the most recent Mortgage that was taken out on this home.
Original Mortgage
$42,980
Interest Rate
5.25%
Mortgage Type
Stand Alone Second
Create a Home Valuation Report for This Property
The Home Valuation Report is an in-depth analysis detailing your home's value as well as a comparison with similar homes in the area
Home Values in the Area
Average Home Value in this Area
Purchase History
| Date | Buyer | Sale Price | Title Company |
|---|---|---|---|
| Sasamajo Inc | -- | None Available | |
| Puentes Sandra | $135,000 | Attorney | |
| Hwang Jeanping | $124,000 | Ad Valorem Title Llc | |
| Aphis Investment Llc | $56,000 | Servicelink | |
| The Bank Of New York Mellon | -- | Attorney | |
| Serrano Ivon | $214,900 | -- |
Source: Public Records
Mortgage History
| Date | Status | Borrower | Loan Amount |
|---|---|---|---|
| Previous Owner | Serrano Ivon | $42,980 |
Source: Public Records
Tax History Compared to Growth
Tax History
| Year | Tax Paid | Tax Assessment Tax Assessment Total Assessment is a certain percentage of the fair market value that is determined by local assessors to be the total taxable value of land and additions on the property. | Land | Improvement |
|---|---|---|---|---|
| 2025 | $5,707 | $265,960 | -- | -- |
| 2024 | $5,146 | $265,960 | -- | -- |
| 2023 | $5,146 | $219,810 | $0 | $0 |
| 2022 | $4,357 | $199,830 | $19,980 | $179,850 |
| 2021 | $4,034 | $183,440 | $18,340 | $165,100 |
| 2020 | $3,679 | $167,540 | $16,750 | $150,790 |
| 2019 | $3,591 | $163,320 | $16,330 | $146,990 |
| 2018 | $3,245 | $149,340 | $14,930 | $134,410 |
| 2017 | $3,043 | $137,070 | $0 | $0 |
| 2016 | $2,929 | $128,720 | $0 | $0 |
| 2015 | $2,748 | $117,120 | $0 | $0 |
| 2014 | $2,485 | $106,640 | $0 | $0 |
| 2013 | -- | $68,040 | $6,800 | $61,240 |
Source: Public Records
Map
Nearby Homes
- 4017 NW 90th Ave Unit 4017
- 3910 NW 90th Ave
- 9166 NW 40th Place
- 3860 NW 90th Way
- 4005 NW 91st Terrace
- 5121 N Pine Island Rd
- 8789 NW 39th St Unit 8789
- 4085 NW 87th Ave Unit 4085
- 3987 NW 87th Ave Unit 3987
- 8771 NW 39th St Unit 8771
- 4098 N Pine Island Rd Unit 1001
- 4007 NW 87th Ave Unit 4007
- 3971 NW 87th Ave Unit 3971
- 9330 NW 39th St
- 3701 NW 90th Terrace
- 4020 NW 93rd Way
- 3961 NW 87th Ave Unit 3961
- 3679 NW 91st Ln
- 8731 NW 39th St Unit 8731
- 9360 NW 42nd Ct
- 4033 NW 90th Ave Unit 4033
- 4037 NW 90th Ave
- 4037 NW 90th Ave Unit 4037
- 4041 NW 90th Ave Unit 4041
- 4041 NW 90th Ave Unit 4041
- 4045 NW 90th Ave Unit 4045
- 4045 NW 90th Ave Unit 4045
- 4049 NW 90th Ave Unit 4049
- 4049 NW 90th Ave Unit 4049
- 4025 NW 90th Ave Unit 4025
- 4025 NW 90th Ave
- 4025 NW 90th Ave Unit 4025
- 4021 NW 90th Ave Unit 4021
- 4017 NW 90th Ave Unit 4017
- 4017 NW 90th Ave Unit 4017
- 4021 NW 90th Ave Unit 4021
- 4013 NW 90th Ave Unit 4013
- 4009 NW 90th Ave Unit 4009
- 4009 NW 90th Ave Unit 4009