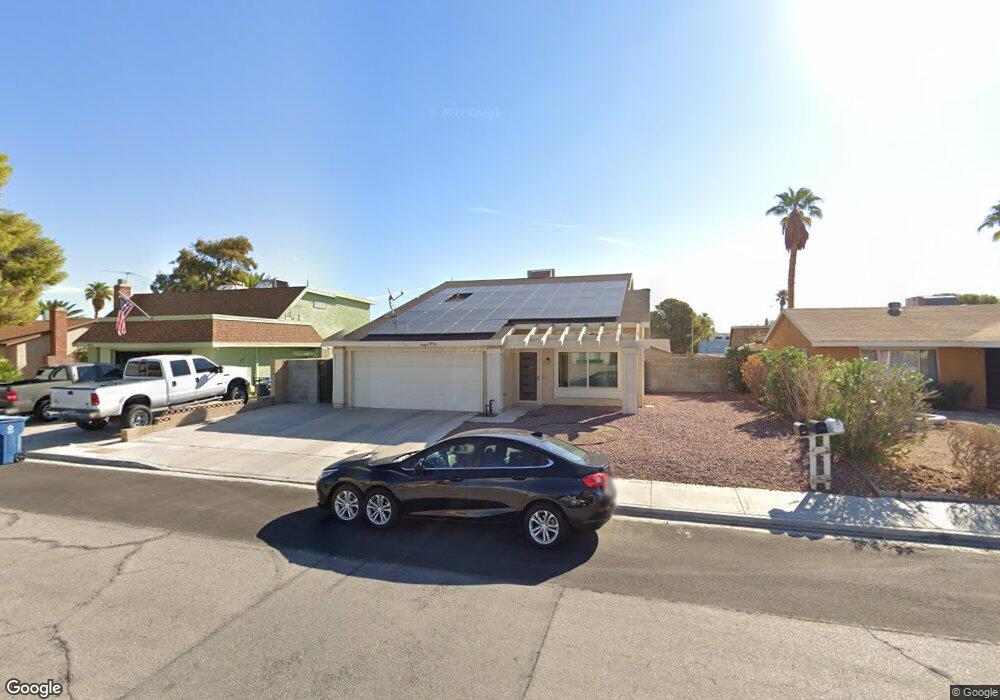
4034 Belhaven St Unit 7 Las Vegas, NV 89147
Estimated Value: $353,000 - $432,000
4
Beds
2
Baths
1,532
Sq Ft
$266/Sq Ft
Est. Value
About This Home
This home is located at 4034 Belhaven St Unit 7, Las Vegas, NV 89147 and is currently estimated at $408,197, approximately $266 per square foot. 4034 Belhaven St Unit 7 is a home located in Clark County with nearby schools including Pat Diskin Elementary School, Clifford J Lawrence Junior High School, and Spring Valley High School.
Ownership History
Date
Name
Owned For
Owner Type
Purchase Details
Closed on
Aug 26, 2011
Sold by
Ncm Reo Acquisition Iv Llc
Bought by
Hill Anthony
Current Estimated Value
Home Financials for this Owner
Home Financials are based on the most recent Mortgage that was taken out on this home.
Original Mortgage
$121,831
Outstanding Balance
$83,787
Interest Rate
4.35%
Mortgage Type
FHA
Estimated Equity
$324,410
Purchase Details
Closed on
May 18, 2010
Sold by
Rutledge Paul A
Bought by
Ncm Reo Acquisition Iv Llc
Purchase Details
Closed on
Jul 15, 2005
Sold by
Rutledge Sharon J
Bought by
Rutledge Paul A
Home Financials for this Owner
Home Financials are based on the most recent Mortgage that was taken out on this home.
Original Mortgage
$250,000
Interest Rate
7.45%
Mortgage Type
New Conventional
Purchase Details
Closed on
Apr 2, 2002
Sold by
Jonah Michael Eric
Bought by
Rutledge Paul A and Rutledge Sharon J
Home Financials for this Owner
Home Financials are based on the most recent Mortgage that was taken out on this home.
Original Mortgage
$149,154
Interest Rate
6.78%
Mortgage Type
FHA
Purchase Details
Closed on
Jan 8, 2002
Sold by
Barkley Gwen E
Bought by
Jonah Michael Eric
Home Financials for this Owner
Home Financials are based on the most recent Mortgage that was taken out on this home.
Original Mortgage
$105,300
Interest Rate
7.01%
Purchase Details
Closed on
Dec 5, 2001
Sold by
Coiner David
Bought by
Backley Gwen E
Home Financials for this Owner
Home Financials are based on the most recent Mortgage that was taken out on this home.
Original Mortgage
$105,300
Interest Rate
7.01%
Purchase Details
Closed on
Jan 10, 2001
Sold by
Barkley Richard T
Bought by
Barkley Gwen E
Purchase Details
Closed on
Aug 21, 2000
Sold by
Barkley Gwen E
Bought by
Barkley Gwen E and Coiner David J
Purchase Details
Closed on
Aug 10, 2000
Sold by
Barkley Richard T
Bought by
Barkley Gwen E
Purchase Details
Closed on
Oct 26, 1994
Sold by
Moreo Jerry and Moreo Judith A
Bought by
Barkley Richard and Barkley Gwen
Home Financials for this Owner
Home Financials are based on the most recent Mortgage that was taken out on this home.
Original Mortgage
$99,750
Interest Rate
8.7%
Create a Home Valuation Report for This Property
The Home Valuation Report is an in-depth analysis detailing your home's value as well as a comparison with similar homes in the area
Home Values in the Area
Average Home Value in this Area
Purchase History
| Date | Buyer | Sale Price | Title Company |
|---|---|---|---|
| Hill Anthony | $125,000 | Equity Title Of Nevada | |
| Hill Anthony | $125,000 | Equity Title Of Nevada | |
| Ncm Reo Acquisition Iv Llc | $98,000 | Nevada Title Las Vegas | |
| Rutledge Paul A | -- | Nevada Title Company | |
| Rutledge Paul A | $151,500 | Fidelity National Title | |
| Jonah Michael Eric | $117,000 | Fidelity National Title | |
| Backley Gwen E | -- | Fidelity National Title | |
| Barkley Gwen E | -- | Fidelity National Title | |
| Barkley Gwen E | -- | -- | |
| Barkley Gwen E | -- | -- | |
| Barkley Richard | $105,000 | United Title |
Source: Public Records
Mortgage History
| Date | Status | Borrower | Loan Amount |
|---|---|---|---|
| Open | Hill Anthony | $121,831 | |
| Closed | Hill Anthony | $121,831 | |
| Previous Owner | Rutledge Paul A | $250,000 | |
| Previous Owner | Rutledge Paul A | $149,154 | |
| Previous Owner | Jonah Michael Eric | $105,300 | |
| Previous Owner | Barkley Richard | $99,750 |
Source: Public Records
Tax History Compared to Growth
Tax History
| Year | Tax Paid | Tax Assessment Tax Assessment Total Assessment is a certain percentage of the fair market value that is determined by local assessors to be the total taxable value of land and additions on the property. | Land | Improvement |
|---|---|---|---|---|
| 2025 | $1,768 | $68,070 | $35,350 | $32,720 |
| 2024 | $1,845 | $68,070 | $35,350 | $32,720 |
| 2023 | $1,845 | $67,389 | $35,000 | $32,389 |
| 2022 | $1,723 | $57,713 | $27,300 | $30,413 |
| 2021 | $1,460 | $52,995 | $23,450 | $29,545 |
| 2020 | $1,301 | $53,357 | $23,450 | $29,907 |
| 2019 | $1,219 | $50,954 | $21,000 | $29,954 |
| 2018 | $1,164 | $48,575 | $19,250 | $29,325 |
| 2017 | $1,401 | $47,777 | $17,500 | $30,277 |
| 2016 | $1,090 | $43,729 | $12,600 | $31,129 |
| 2015 | $1,087 | $41,696 | $10,500 | $31,196 |
| 2014 | $1,053 | $34,845 | $8,050 | $26,795 |
Source: Public Records
Map
Nearby Homes
- 7285 Bridgeview Ave
- 3944 Belhaven St
- 7225 Bridgeview Ave
- 7400 W Flamingo Rd Unit 1033
- 7400 W Flamingo Rd Unit 2013
- 7400 W Flamingo Rd Unit 2056
- 7400 W Flamingo Rd Unit 1087
- 7247 Pleasant View Ave
- 7274 Pinebrook Cir
- 7075 Starwood Dr
- 7285 Pinebrook Cir
- 3869 Birchview Ct
- 7229 Pinebrook Cir
- 3957 Laurel Brook Dr
- 3869 Mapleview Ct
- 7570 W Flamingo Rd Unit 142
- 7012 Grassy Knoll St
- 3869 Spruceview Ct
- 7130 Wedgewood Way
- 3862 Willowview Ct Unit II
- 4024 Belhaven St
- 4044 Belhaven St
- 4037 Bridgeview Cir
- 4027 Bridgeview Cir
- 4047 Bridgeview Cir
- 4014 Belhaven St
- 4054 Belhaven St
- 4017 Bridgeview Cir
- 4035 Belhaven St
- 4057 Bridgeview Cir
- 4045 Belhaven St
- 4004 Belhaven St
- 4064 Belhaven St
- 4015 Belhaven St
- 4055 Belhaven St
- 4007 Bridgeview Cir
- 4067 Bridgeview Cir
- 4005 Belhaven St Unit 7
- 3994 Belhaven St