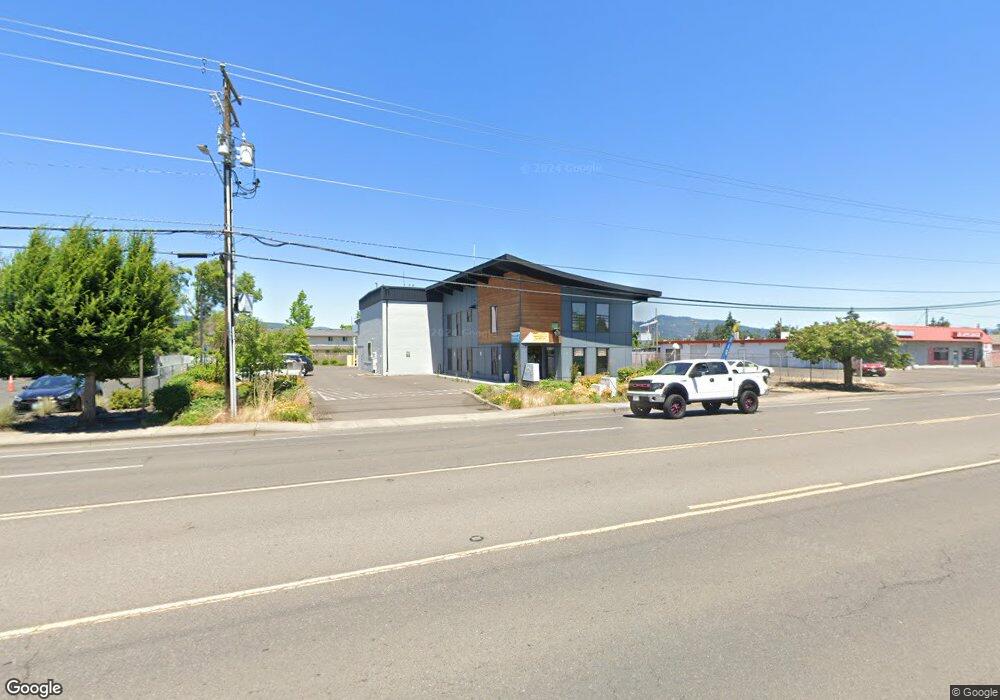
4034 Main St Springfield, OR 97478
East Springfield NeighborhoodEstimated Value: $1,816,728
Studio
--
Bath
6,252
Sq Ft
$291/Sq Ft
Est. Value
About This Home
This home is located at 4034 Main St, Springfield, OR 97478 and is currently estimated at $1,816,728, approximately $290 per square foot. 4034 Main St is a home located in Lane County with nearby schools including Riverbend Elementary School, Briggs Middle School, and Thurston High School.
Ownership History
Date
Name
Owned For
Owner Type
Purchase Details
Closed on
Feb 13, 2023
Sold by
Fuiten West Partnership Limited Partners
Bought by
Koza Holdings Main Street Llc
Current Estimated Value
Home Financials for this Owner
Home Financials are based on the most recent Mortgage that was taken out on this home.
Original Mortgage
$1,462,000
Outstanding Balance
$1,393,329
Interest Rate
6.48%
Mortgage Type
New Conventional
Estimated Equity
$423,399
Purchase Details
Closed on
Jun 27, 2019
Sold by
Fuiten West Partnership Lp
Bought by
Fuiten West Partnership
Home Financials for this Owner
Home Financials are based on the most recent Mortgage that was taken out on this home.
Original Mortgage
$4,435,044
Interest Rate
4%
Mortgage Type
Commercial
Purchase Details
Closed on
Sep 23, 2015
Sold by
Westover Realty Inc
Bought by
Fuiten West Partnership
Create a Home Valuation Report for This Property
The Home Valuation Report is an in-depth analysis detailing your home's value as well as a comparison with similar homes in the area
Home Values in the Area
Average Home Value in this Area
Purchase History
| Date | Buyer | Sale Price | Title Company |
|---|---|---|---|
| Koza Holdings Main Street Llc | $1,720,000 | First American Title | |
| Fuiten West Partnership | -- | First American Title | |
| Fuiten West Partnership | $460,000 | First American |
Source: Public Records
Mortgage History
| Date | Status | Borrower | Loan Amount |
|---|---|---|---|
| Open | Koza Holdings Main Street Llc | $1,462,000 | |
| Previous Owner | Fuiten West Partnership | $4,435,044 |
Source: Public Records
Tax History
| Year | Tax Paid | Tax Assessment Tax Assessment Total Assessment is a certain percentage of the fair market value that is determined by local assessors to be the total taxable value of land and additions on the property. | Land | Improvement |
|---|---|---|---|---|
| 2025 | $7,249 | $395,311 | -- | -- |
| 2024 | $7,132 | $383,798 | -- | -- |
| 2023 | $7,132 | $372,620 | $0 | $0 |
| 2022 | $6,605 | $361,767 | $0 | $0 |
| 2021 | $6,487 | $351,231 | $0 | $0 |
| 2020 | $6,297 | $341,001 | $0 | $0 |
| 2019 | $6,108 | $331,069 | $0 | $0 |
| 2018 | $4,927 | $246,439 | $0 | $0 |
| 2017 | $4,372 | $246,439 | $0 | $0 |
| 2016 | $4,280 | $239,261 | $0 | $0 |
| 2015 | $4,158 | $232,292 | $0 | $0 |
| 2014 | $4,095 | $225,526 | $0 | $0 |
Source: Public Records
Map
Nearby Homes
Your Personal Tour Guide
Ask me questions while you tour the home.