
Landlord's Agent in 2025
KeAnna Jones
HomeSmart
(770) 882-3164
154 Total Sales
Estimated Value: $427,000 - $437,000
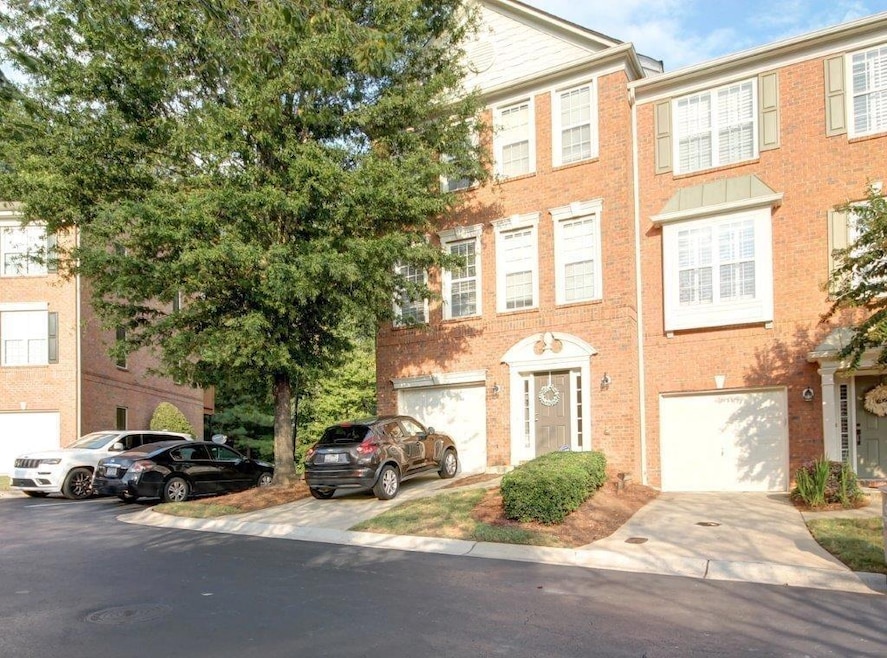
This Beautiful three story home is conveniently located near schools, shopping, dining and expressways. With a finished lower level with a third bedroom / possible home office, powder room, and laundry room leading to the outside patio and relaxing hot tub. Main level entertaining with spacious kitchen and breakfast area overlooking a large family room leading to the outdoor private deck. Third level features two bedrooms with vaulted ceilings each with a full bathroom and walk in closet. Private End Unit. Just minutes from the Chattahoochee River and Riverside Park.
| Date | Buyer | Sale Price | Title Company |
|---|---|---|---|
| Zhang Ping | $192,400 | -- |
| Date | Event | Price | List to Sale | Price per Sq Ft | Prior Sale |
|---|---|---|---|---|---|
| 01/31/2025 01/31/25 | Rented | $2,650 | 0.0% | -- | |
| 12/24/2024 12/24/24 | Under Contract | -- | -- | -- | |
| 12/01/2024 12/01/24 | For Rent | $2,650 | 0.0% | -- | |
| 02/12/2023 02/12/23 | Rented | $2,650 | +6.0% | -- | |
| 01/20/2023 01/20/23 | For Rent | $2,500 | 0.0% | -- | |
| 03/13/2022 03/13/22 | Rented | $2,500 | 0.0% | -- | |
| 03/09/2022 03/09/22 | For Rent | $2,500 | +4.2% | -- | |
| 01/23/2022 01/23/22 | Rented | $2,400 | 0.0% | -- | |
| 01/11/2022 01/11/22 | For Rent | $2,400 | +6.7% | -- | |
| 08/04/2021 08/04/21 | Rented | $2,250 | 0.0% | -- | |
| 08/02/2021 08/02/21 | Under Contract | -- | -- | -- | |
| 08/01/2021 08/01/21 | For Rent | $2,250 | +12.5% | -- | |
| 08/13/2020 08/13/20 | Rented | $2,000 | 0.0% | -- | |
| 07/31/2020 07/31/20 | For Rent | $2,000 | 0.0% | -- | |
| 09/27/2019 09/27/19 | Rented | $2,000 | 0.0% | -- | |
| 09/17/2019 09/17/19 | For Rent | $2,000 | +2.6% | -- | |
| 09/12/2018 09/12/18 | Rented | $1,950 | -1.5% | -- | |
| 08/20/2018 08/20/18 | Price Changed | $1,980 | -5.7% | $1 / Sq Ft | |
| 08/13/2018 08/13/18 | Price Changed | $2,100 | -8.7% | $1 / Sq Ft | |
| 08/08/2018 08/08/18 | For Rent | $2,300 | 0.0% | -- | |
| 02/07/2014 02/07/14 | Sold | $192,400 | -3.8% | $107 / Sq Ft | View Prior Sale |
| 01/26/2014 01/26/14 | Pending | -- | -- | -- | |
| 12/03/2013 12/03/13 | For Sale | $199,900 | -- | $112 / Sq Ft |
| Year | Tax Paid | Tax Assessment Tax Assessment Total Assessment is a certain percentage of the fair market value that is determined by local assessors to be the total taxable value of land and additions on the property. | Land | Improvement |
|---|---|---|---|---|
| 2025 | $778 | $153,680 | $41,160 | $112,520 |
| 2023 | $3,726 | $132,000 | $20,360 | $111,640 |
| 2022 | $3,473 | $132,000 | $20,360 | $111,640 |
| 2021 | $3,529 | $110,800 | $17,360 | $93,440 |
| 2020 | $3,584 | $109,440 | $17,120 | $92,320 |
| 2019 | $490 | $98,800 | $20,400 | $78,400 |
| 2018 | $2,477 | $87,760 | $11,200 | $76,560 |
| 2017 | $2,128 | $72,920 | $15,000 | $57,920 |
| 2016 | $2,128 | $72,920 | $15,000 | $57,920 |
| 2015 | $2,534 | $72,920 | $15,000 | $57,920 |
| 2014 | $1,849 | $60,320 | $12,400 | $47,920 |
Landlord's Agent in 2025
KeAnna Jones
HomeSmart
(770) 882-3164
154 Total Sales
Landlord's Co-Listing Agent in 2025
Nimmie M Burney III
HomeSmart
(404) 246-6965
31 Total Sales
Tenant's Agent in 2025
Greta Massey
Keller Williams Rlty Consultants
(662) 603-5445
2 in this area
30 Total Sales
D
Seller's Agent in 2023
Dewi Warmus
Warmus Properties, LLC.
(770) 871-1812
1 in this area
39 Total Sales
C
Buyer's Agent in 2021
Crystal Byrd
NOT A VALID MEMBER
K
Seller's Agent in 2014
KACY C LEWIS
NOT A VALID MEMBER
Source: First Multiple Listing Service (FMLS)
MLS Number: 7492165
APN: 12-1620-0233-083-8
Disclaimer: Certain information contained herein is derived from information provided by parties other than Homes.com. All information provided is deemed reliable, but is not guaranteed to be accurate and should be independently verified.
![]() Listings identified with the FMLS IDX logo come from FMLS and are held by brokerage firms other than the owner of this website. The listing brokerage is identified in any listing details. Information is deemed reliable but is not guaranteed. If you believe any FMLS listing contains material that infringes your copyrighted work please visit www.fmls.com/dmca to review our DMCA policy and learn how to submit a takedown request. © 2025 First Multiple Listing Service, Inc.
Listings identified with the FMLS IDX logo come from FMLS and are held by brokerage firms other than the owner of this website. The listing brokerage is identified in any listing details. Information is deemed reliable but is not guaranteed. If you believe any FMLS listing contains material that infringes your copyrighted work please visit www.fmls.com/dmca to review our DMCA policy and learn how to submit a takedown request. © 2025 First Multiple Listing Service, Inc.