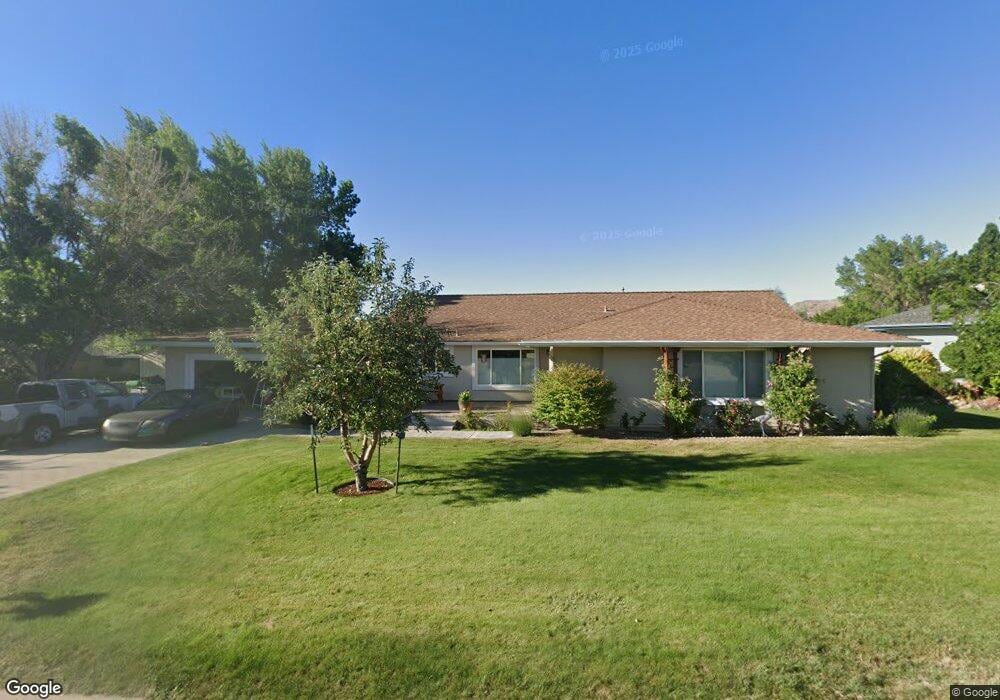
4035 Inverness Dr Reno, NV 89502
Hidden Valley NeighborhoodEstimated Value: $783,000 - $962,000
3
Beds
3
Baths
2,025
Sq Ft
$423/Sq Ft
Est. Value
About This Home
This home is located at 4035 Inverness Dr, Reno, NV 89502 and is currently estimated at $856,331, approximately $422 per square foot. 4035 Inverness Dr is a home located in Washoe County with nearby schools including Hidden Valley Elementary School, Edward L Pine Middle School, and Earl Wooster High School.
Ownership History
Date
Name
Owned For
Owner Type
Purchase Details
Closed on
Jul 17, 2025
Sold by
Mann Eric Nelson and Mann Cheryl-Anna Ryan
Bought by
Mann Cheryl-Anna Ryan and Mann Eric
Current Estimated Value
Home Financials for this Owner
Home Financials are based on the most recent Mortgage that was taken out on this home.
Original Mortgage
$675,500
Outstanding Balance
$674,356
Interest Rate
6.85%
Mortgage Type
Credit Line Revolving
Estimated Equity
$181,975
Purchase Details
Closed on
Jun 23, 2014
Sold by
Mann Eric
Bought by
Mann Cheryl Anna Ryan and Ryan Mann C
Home Financials for this Owner
Home Financials are based on the most recent Mortgage that was taken out on this home.
Original Mortgage
$100,001
Interest Rate
4.17%
Mortgage Type
New Conventional
Purchase Details
Closed on
Aug 5, 2010
Sold by
Schlingheyde Richard
Bought by
Mann Eric and Ryan Mann C
Purchase Details
Closed on
Jul 23, 2007
Sold by
Golden Richard
Bought by
Golden Richard and The Richard Golden Family Trust
Create a Home Valuation Report for This Property
The Home Valuation Report is an in-depth analysis detailing your home's value as well as a comparison with similar homes in the area
Home Values in the Area
Average Home Value in this Area
Purchase History
| Date | Buyer | Sale Price | Title Company |
|---|---|---|---|
| Mann Cheryl-Anna Ryan | -- | Ticor Title | |
| Mann Cheryl Anna Ryan | -- | Western Title Company Inc | |
| Mann Cheryl Anna Ryan | -- | Western Title Co | |
| Mann Eric | $210,000 | Western Title Company | |
| Golden Richard | -- | None Available |
Source: Public Records
Mortgage History
| Date | Status | Borrower | Loan Amount |
|---|---|---|---|
| Open | Mann Cheryl-Anna Ryan | $675,500 | |
| Previous Owner | Mann Cheryl Anna Ryan | $100,001 |
Source: Public Records
Tax History Compared to Growth
Tax History
| Year | Tax Paid | Tax Assessment Tax Assessment Total Assessment is a certain percentage of the fair market value that is determined by local assessors to be the total taxable value of land and additions on the property. | Land | Improvement |
|---|---|---|---|---|
| 2025 | $3,342 | $164,336 | $88,813 | $75,523 |
| 2024 | $3,342 | $155,597 | $78,908 | $76,690 |
| 2023 | $2,351 | $152,151 | $78,908 | $73,244 |
| 2022 | $3,154 | $123,386 | $61,950 | $61,436 |
| 2021 | $3,063 | $108,935 | $47,618 | $61,317 |
| 2020 | $2,251 | $109,949 | $47,618 | $62,331 |
| 2019 | $2,882 | $105,173 | $43,995 | $61,178 |
| 2018 | $2,639 | $93,529 | $33,128 | $60,401 |
| 2017 | $2,241 | $91,885 | $31,658 | $60,227 |
| 2016 | $2,329 | $91,145 | $29,204 | $61,941 |
| 2015 | $703 | $86,320 | $24,647 | $61,673 |
| 2014 | $2,456 | $80,971 | $20,895 | $60,076 |
| 2013 | -- | $77,890 | $18,806 | $59,084 |
Source: Public Records
Map
Nearby Homes
- 3477 E Hidden Valley Dr Unit 3
- 5409 Greenview Ct
- 6815 Prestwick Cir
- 4841 W Hidden Valley Dr
- 5329 Mira Loma Dr
- 5279 Mira Loma Dr
- 5705 Blue Hills Dr
- 3690 Sleepy Hollow Dr
- 5595 Saint Andrews Ct
- 2915 Fairwood Dr
- 2835 Parkway Dr
- 5675 E Hidden Valley Dr
- 3069 Creekwood Dr
- 3455 Craviasco Ln
- 3105 Fairwood Dr
- 5977 Hidden Highlands Dr
- 2265 Silky Sullivan Ln
- 5979 Hidden Highlands Dr
- 5984 Hidden Highlands Dr
- 2100 Parkway Dr
- 4045 Inverness Dr
- 4025 Inverness Dr
- 4055 Inverness Dr
- 4200 Inwood Ln
- 4015 Inverness Dr
- 4115 Inwood Ln Unit 4
- 4005 Inverness Dr
- 4065 Inverness Dr
- 4125 Inwood Ln
- 4190 Inwood Ln
- 4070 Inwood Ln
- 4100 Inwood Ln
- 4135 Inwood Ln
- 3790 W Hidden Valley Dr
- 4110 Inwood Ln
- 3880 W Hidden Valley Dr
- 4120 Inwood Ln
- 3990 W Hidden Valley Dr
- 4210 Inverness Dr
- 4155 Inwood Ln