
Seller's Agent in 2025
Melina Olivares
Robbins and Associates Realty
(919) 724-3346
1 in this area
44 Total Sales
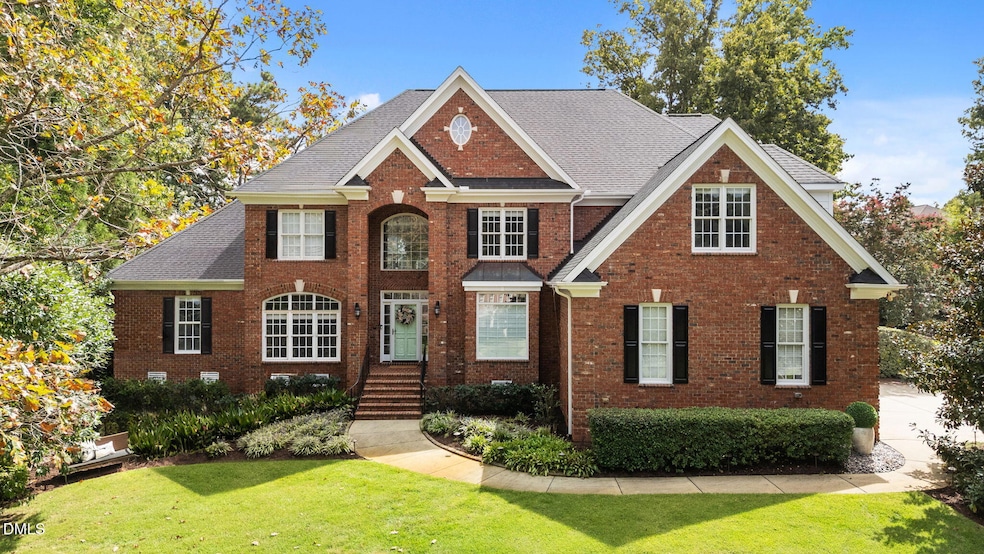


Welcome home—this is the one you've been waiting for.
Set on a beautifully landscaped 3⁄4-acre corner lot in the coveted Grenadier subdivision, this exceptional luxury residence combines timeless elegance with modern innovation, offering a true lifestyle experience both indoors and out.
Step inside and be captivated by the custom-designed chef's kitchen, a masterpiece blending beauty and function. Outfitted with Wolf appliances, a Thermador built-in refrigerator, XO wine fridge, quartz countertops, quarter-sawn oak cabinetry, and a cast iron Kohler sink, this kitchen is equally suited for gourmet entertaining or everyday living. The adjoining sunroom, bathed in natural light, invites morning coffee and casual relaxation, while the spectacular family room with its vaulted ceilings, fireplace, & custom built-ins, offers the perfect gathering space.
The main-floor primary suite is designed as a restful escape, with sweeping views of the pool and direct patio access. Elevated lifestyle living continues throughout the home with custom cabinetry, hardwoods, designer lighting, and high-end finishes. Upstairs, each spacious bedroom offers comfort and privacy, complemented by a renovated office with custom built-ins and a remodeled bonus room, complete with wet bar, wine fridge, and updated finishes, creating versatile spaces for work, play, or hosting guests.
Beyond the stunning interiors, the outdoor living is unparalleled. The custom concrete (heated) pool with waterfall and gas fire bowls, in-pool chaises, outdoor kitchen with granite countertops and Memphis pellet grill, expansive paver patios and fire pit set the stage for resort-style entertaining. Outdoor lighting, a new fence with mature privacy screening, and Astroturf accents ensure year-round beauty and function.
This home has been meticulously updated with a new roof, solar panels, two new A/C units, tankless water heater, new hardwoods, custom window treatments, and upgraded fixtures throughout. From Kinetico water filtration system, irrigation system, integrated speakers, smart upgrades and electronic car charging stations in the garage, every detail has been thoughtfully designed to deliver ease of living and energy efficiency. Ideally located on the Apex-Cary border, this home offers suburban tranquility with quick access to shopping, dining, and major Triangle destinations. Nearby parks and greenways, top-rated schools, and outstanding quality of life make this an unbeatable location.
Last Agent to Sell the Property
Robbins and Associates Realty License #285988 Listed on: 09/19/2025
| Date | Type | Sale Price | Title Company |
|---|---|---|---|
| Warranty Deed | $1,525,000 | None Listed On Document | |
| Interfamily Deed Transfer | -- | American Home Title Llc | |
| Quit Claim Deed | -- | None Listed On Document | |
| Warranty Deed | $697,500 | None Listed On Document | |
| Warranty Deed | $730,000 | -- |
| Date | Status | Loan Amount | Loan Type |
|---|---|---|---|
| Open | $806,600 | New Conventional | |
| Previous Owner | $510,000 | New Conventional | |
| Previous Owner | $557,600 | New Conventional |
| Date | Event | Price | List to Sale | Price per Sq Ft |
|---|---|---|---|---|
| 10/27/2025 10/27/25 | Sold | $1,525,000 | +5.2% | $313 / Sq Ft |
| 09/20/2025 09/20/25 | Pending | -- | -- | -- |
| 09/19/2025 09/19/25 | For Sale | $1,450,000 | -- | $298 / Sq Ft |
| Year | Tax Paid | Tax Assessment Tax Assessment Total Assessment is a certain percentage of the fair market value that is determined by local assessors to be the total taxable value of land and additions on the property. | Land | Improvement |
|---|---|---|---|---|
| 2025 | $7,040 | $1,097,615 | $240,000 | $857,615 |
| 2024 | $6,836 | $1,097,615 | $240,000 | $857,615 |
| 2023 | $5,622 | $718,430 | $100,000 | $618,430 |
| 2022 | $5,208 | $718,400 | $100,000 | $618,400 |
| 2021 | $5,068 | $718,400 | $100,000 | $618,400 |
| 2020 | $4,984 | $718,400 | $100,000 | $618,400 |
| 2019 | $6,613 | $807,275 | $100,000 | $707,275 |
| 2018 | $6,078 | $807,275 | $100,000 | $707,275 |
| 2017 | $5,760 | $807,275 | $100,000 | $707,275 |
| 2016 | $5,643 | $807,275 | $100,000 | $707,275 |
| 2015 | $5,785 | $830,135 | $125,000 | $705,135 |
| 2014 | $5,482 | $830,135 | $125,000 | $705,135 |
Seller's Agent in 2025
Melina Olivares
Robbins and Associates Realty
(919) 724-3346
1 in this area
44 Total Sales
Buyer's Agent in 2025
Jim Cleveland
Keller Williams Legacy
(919) 741-0923
14 in this area
65 Total Sales
Source: Doorify MLS
MLS Number: 10122746
APN: 0760.01-48-0748-000
Disclaimer: Certain information contained herein is derived from information provided by parties other than Homes.com. All information provided is deemed reliable, but is not guaranteed to be accurate and should be independently verified.
![]() Some IDX listings have been excluded from this IDX display. Brokers make an effort to deliver accurate information, but buyers should independently verify any information on which they will rely in a transaction. The listing broker shall not be responsible for any typographical errors, misinformation, or misprints, and they shall be held totally harmless from any damages arising from reliance upon this data. This data is provided exclusively for consumers’ personal, non-commercial use. Listings marked with an icon are provided courtesy of the Doorify MLS, Inc. of North Carolina, Internet Data Exchange Database. Closed (sold) listings may have been listed and/or sold by a real estate firm other than the firm(s) featured on this website. Closed data is not available until the sale of the property is recorded in the MLS. Home sale data is not an appraisal, CMA, competitive or comparative market analysis, or home valuation of any property. Copyright 2026 Doorify MLS, Inc. of North Carolina. All rights reserved.
Some IDX listings have been excluded from this IDX display. Brokers make an effort to deliver accurate information, but buyers should independently verify any information on which they will rely in a transaction. The listing broker shall not be responsible for any typographical errors, misinformation, or misprints, and they shall be held totally harmless from any damages arising from reliance upon this data. This data is provided exclusively for consumers’ personal, non-commercial use. Listings marked with an icon are provided courtesy of the Doorify MLS, Inc. of North Carolina, Internet Data Exchange Database. Closed (sold) listings may have been listed and/or sold by a real estate firm other than the firm(s) featured on this website. Closed data is not available until the sale of the property is recorded in the MLS. Home sale data is not an appraisal, CMA, competitive or comparative market analysis, or home valuation of any property. Copyright 2026 Doorify MLS, Inc. of North Carolina. All rights reserved.
Ask me questions while you tour the home.