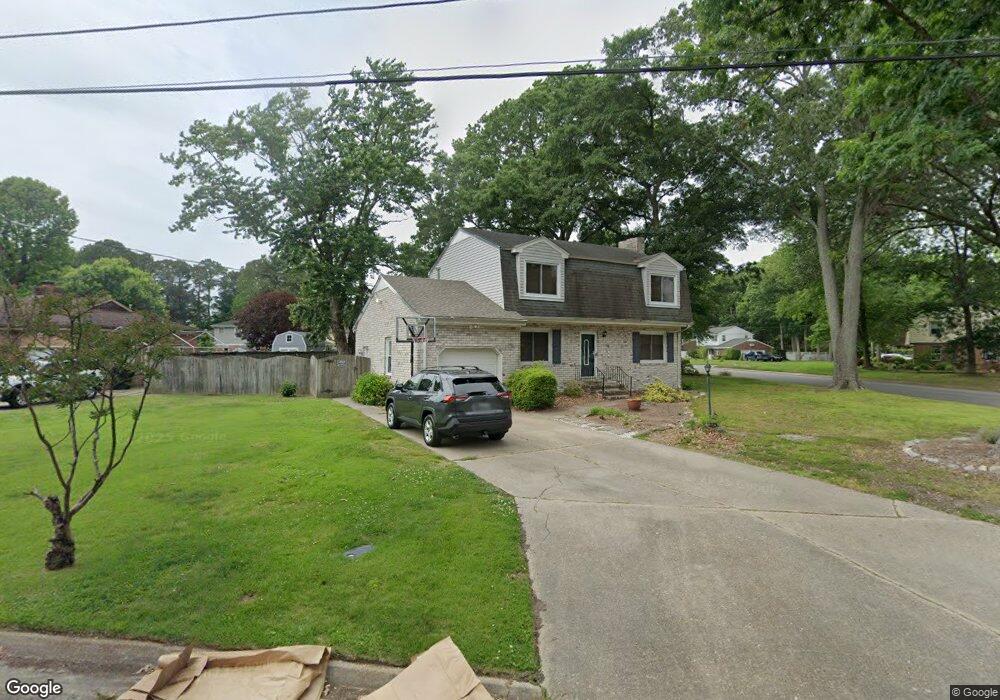
4036 Tarnywood Dr Portsmouth, VA 23703
Churchland NeighborhoodEstimated Value: $296,000 - $367,000
4
Beds
3
Baths
1,700
Sq Ft
$191/Sq Ft
Est. Value
About This Home
This home is located at 4036 Tarnywood Dr, Portsmouth, VA 23703 and is currently estimated at $325,216, approximately $191 per square foot. 4036 Tarnywood Dr is a home located in Portsmouth City with nearby schools including Churchland Primary/Intermediate School, Churchland Middle School, and Churchland High School.
Ownership History
Date
Name
Owned For
Owner Type
Purchase Details
Closed on
Dec 6, 2010
Sold by
Waller Kenneth A
Bought by
Outlaw Adam L
Current Estimated Value
Home Financials for this Owner
Home Financials are based on the most recent Mortgage that was taken out on this home.
Original Mortgage
$194,930
Outstanding Balance
$125,162
Interest Rate
3.75%
Mortgage Type
FHA
Estimated Equity
$200,054
Purchase Details
Closed on
May 18, 2001
Sold by
Gebhardt Lisa
Bought by
Waller Monica E
Home Financials for this Owner
Home Financials are based on the most recent Mortgage that was taken out on this home.
Original Mortgage
$122,900
Interest Rate
7.09%
Purchase Details
Closed on
Jul 26, 1999
Sold by
Handleton Robert T
Bought by
Gebhardt Mark J
Home Financials for this Owner
Home Financials are based on the most recent Mortgage that was taken out on this home.
Original Mortgage
$89,600
Interest Rate
7.61%
Create a Home Valuation Report for This Property
The Home Valuation Report is an in-depth analysis detailing your home's value as well as a comparison with similar homes in the area
Home Values in the Area
Average Home Value in this Area
Purchase History
| Date | Buyer | Sale Price | Title Company |
|---|---|---|---|
| Outlaw Adam L | $200,000 | -- | |
| Waller Monica E | $123,000 | -- | |
| Gebhardt Mark J | $112,000 | -- |
Source: Public Records
Mortgage History
| Date | Status | Borrower | Loan Amount |
|---|---|---|---|
| Open | Outlaw Adam L | $194,930 | |
| Previous Owner | Waller Monica E | $122,900 | |
| Previous Owner | Gebhardt Mark J | $89,600 |
Source: Public Records
Tax History Compared to Growth
Tax History
| Year | Tax Paid | Tax Assessment Tax Assessment Total Assessment is a certain percentage of the fair market value that is determined by local assessors to be the total taxable value of land and additions on the property. | Land | Improvement |
|---|---|---|---|---|
| 2025 | $3,582 | $284,480 | $81,000 | $203,480 |
| 2024 | $3,582 | $277,310 | $81,000 | $196,310 |
| 2023 | $3,252 | $260,120 | $81,000 | $179,120 |
| 2022 | $2,964 | $227,990 | $67,500 | $160,490 |
| 2021 | $2,701 | $207,760 | $54,430 | $153,330 |
| 2020 | $2,630 | $202,300 | $51,840 | $150,460 |
| 2019 | $2,537 | $195,130 | $51,840 | $143,290 |
| 2018 | $2,537 | $195,130 | $51,840 | $143,290 |
| 2017 | $2,537 | $195,130 | $51,840 | $143,290 |
| 2016 | $2,537 | $195,130 | $51,840 | $143,290 |
| 2015 | $2,537 | $195,130 | $51,840 | $143,290 |
| 2014 | $2,478 | $195,130 | $51,840 | $143,290 |
Source: Public Records
Map
Nearby Homes
- 3433 Willow Breeze Dr
- 4008 Oakhurst Rd
- 5807 Dunkin St
- 4028 Swannanoa Dr
- 5806 Fawkes St
- 3604 Lilac Dr
- 4200 Quince Rd
- 3616 Bowden St
- 4100 Mayfair Way
- 4224 Burnham Dr
- 10AC Cedar Ln
- 5911 Dunkirk St
- 4232 Summerset Dr
- 6015 Arthur Ave
- 5516 Bingham Dr
- 3860 Sugar Creek Cir
- 3315 Camellia Dr
- 6002 Campbell St
- 3866 Augustine Cir
- 3660B Towne Point Rd Unit A
- 4032 Tarnywood Dr
- 4029 Timberland Dr
- 4028 Tarnywood Dr
- 4037 Tarnywood Dr
- 4025 Timberland Dr
- 4100 Tarnywood Dr
- 4033 Tarnywood Dr
- 4101 Timberland Dr
- 4029 Tarnywood Dr
- 4021 Timberland Dr
- 4024 Tarnywood Dr
- 4020 Merrifields Blvd
- 4102 Tarnywood Dr
- 4013 Merrifields Blvd
- 4103 Timberland Dr
- 4036 Forresthills Dr
- 4025 Tarnywood Dr
- 4032 Forresthills Dr
- 4017 Timberland Dr
- 4020 Tarnywood Dr