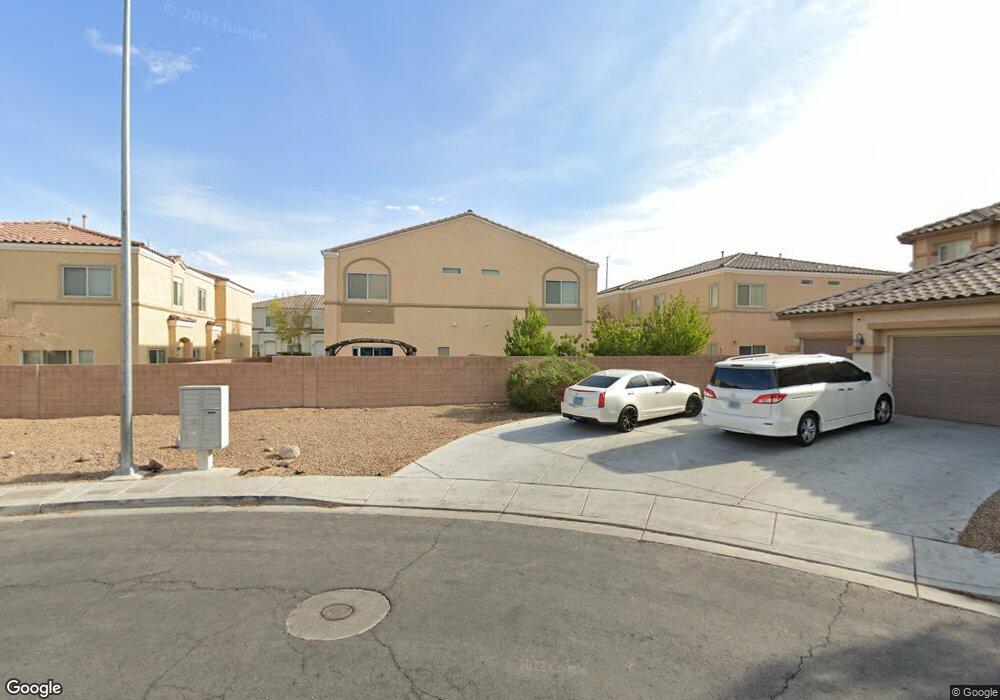
4037 Pepper Thorn Ave Unit 2 North Las Vegas, NV 89081
Northridge NeighborhoodEstimated Value: $284,028 - $294,000
3
Beds
3
Baths
1,253
Sq Ft
$231/Sq Ft
Est. Value
About This Home
This home is located at 4037 Pepper Thorn Ave Unit 2, North Las Vegas, NV 89081 and is currently estimated at $289,757, approximately $231 per square foot. 4037 Pepper Thorn Ave Unit 2 is a home located in Clark County with nearby schools including D.L. Dusty Dickens Elementary School, Carroll M. Johnston STEM Academy of Environmental Studies, and Clifford O. Findlay Middle School.
Ownership History
Date
Name
Owned For
Owner Type
Purchase Details
Closed on
Feb 4, 2020
Sold by
Tuttle Joseph and Tuttle Brenda
Bought by
Thomas Kathleen A
Current Estimated Value
Home Financials for this Owner
Home Financials are based on the most recent Mortgage that was taken out on this home.
Original Mortgage
$178,600
Outstanding Balance
$158,556
Interest Rate
3.74%
Mortgage Type
New Conventional
Estimated Equity
$131,201
Purchase Details
Closed on
Sep 28, 2012
Sold by
Tuttle Joseph and Tuttle Brenda
Bought by
America First Federal Credit Union
Purchase Details
Closed on
Jul 1, 2010
Sold by
Boudreault Robert and Bouderault Robert J
Bought by
Tuttle Joseph and Tuttle Brenda
Purchase Details
Closed on
Feb 16, 2006
Sold by
Centennial Llc
Bought by
Boudreault Robert J
Home Financials for this Owner
Home Financials are based on the most recent Mortgage that was taken out on this home.
Original Mortgage
$179,624
Interest Rate
6.87%
Mortgage Type
Unknown
Create a Home Valuation Report for This Property
The Home Valuation Report is an in-depth analysis detailing your home's value as well as a comparison with similar homes in the area
Home Values in the Area
Average Home Value in this Area
Purchase History
| Date | Buyer | Sale Price | Title Company |
|---|---|---|---|
| Thomas Kathleen A | $188,000 | First American Title | |
| America First Federal Credit Union | $27,500 | First American Title | |
| Tuttle Joseph | $53,000 | North American Title Sahara | |
| Boudreault Robert | -- | North American Title Sahara | |
| Boudreault Robert J | $224,531 | Nevada Title Company |
Source: Public Records
Mortgage History
| Date | Status | Borrower | Loan Amount |
|---|---|---|---|
| Open | Thomas Kathleen A | $178,600 | |
| Previous Owner | Boudreault Robert J | $179,624 |
Source: Public Records
Tax History Compared to Growth
Tax History
| Year | Tax Paid | Tax Assessment Tax Assessment Total Assessment is a certain percentage of the fair market value that is determined by local assessors to be the total taxable value of land and additions on the property. | Land | Improvement |
|---|---|---|---|---|
| 2025 | $753 | $62,092 | $23,100 | $38,992 |
| 2024 | $732 | $62,092 | $23,100 | $38,992 |
| 2023 | $597 | $60,538 | $24,850 | $35,688 |
| 2022 | $711 | $53,967 | $21,000 | $32,967 |
| 2021 | $690 | $50,845 | $18,900 | $31,945 |
| 2020 | $691 | $49,916 | $18,200 | $31,716 |
| 2019 | $647 | $46,793 | $15,400 | $31,393 |
| 2018 | $629 | $34,867 | $7,700 | $27,167 |
| 2017 | $1,114 | $33,196 | $7,000 | $26,196 |
| 2016 | $597 | $32,251 | $6,650 | $25,601 |
| 2015 | $594 | $24,389 | $3,500 | $20,889 |
| 2014 | $577 | $16,681 | $4,200 | $12,481 |
Source: Public Records
Map
Nearby Homes
- 6313 Snap Ridge St Unit 201
- 6323 Pacific Sky St
- 4021 Pepper Thorn Ave Unit 102
- 6328 Sandy Ridge St Unit 201
- 4116 Cloudy Night Ave
- 6312 Beige Bluff St Unit 102
- 6316 Beige Bluff St Unit 201
- 3920 Smokey Fog Ave Unit 201
- 3913 Pepper Thorn Ave Unit 201
- 6329 Blowing Sky St Unit 201
- 4211 Enchanting Sky Ave
- 6117 Bugsy St
- 4016 Gaster Ave
- 4146 Nipp Ave
- 6247 Fort Worth St Unit 1
- 3844 Hollycroft Dr
- 6021 Vivanco St
- 6325 Gambetta St
- 6225 Gambetta St
- 6009 La Coste St
- 4037 Pepper Thorn Ave Unit 3
- 4037 Pepper Thorn Ave Unit 1
- 4037 Pepper Thorn Ave Unit 102
- 4037 Pepper Thorn Ave Unit 101
- 4037 Pepper Thorn Ave Unit 201
- 4033 Pepper Thorn Ave Unit 1
- 4033 Pepper Thorn Ave Unit 2
- 4033 Pepper Thorn Ave Unit 3
- 4033 Pepper Thorn Ave Unit 102
- 4033 Pepper Thorn Ave Unit 101
- 4033 Pepper Thorn Ave Unit 201
- 4041 Pepper Thorn Ave Unit 1
- 4041 Pepper Thorn Ave Unit 2
- 4041 Pepper Thorn Ave Unit 3
- 4041 Pepper Thorn Ave Unit 101
- 4041 Pepper Thorn Ave Unit 201
- 4041 Pepper Thorn Ave Unit 102
- 6236 Darby Creek Ct
- 6312 Snap Ridge St Unit 2
- 6312 Snap Ridge St Unit 1