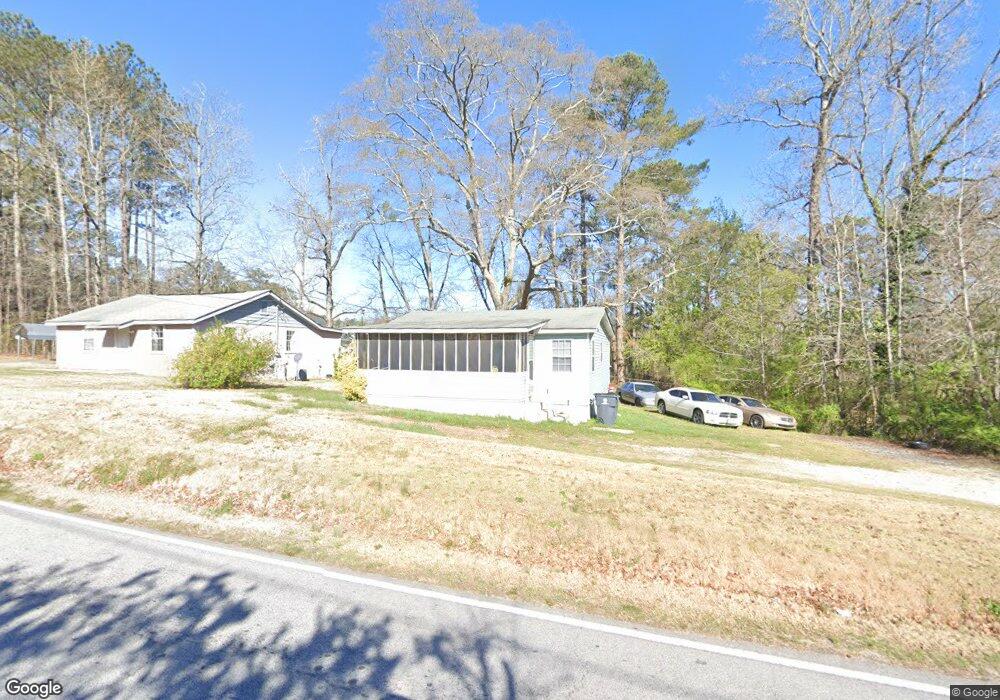
4037 Riley Rd Lithia Springs, GA 30122
Lithia Springs NeighborhoodEstimated Value: $160,143 - $248,000
3
Beds
1
Bath
712
Sq Ft
$296/Sq Ft
Est. Value
About This Home
This home is located at 4037 Riley Rd, Lithia Springs, GA 30122 and is currently estimated at $211,036, approximately $296 per square foot. 4037 Riley Rd is a home located in Douglas County with nearby schools including Lithia Springs Elementary School, Turner Middle School, and Lithia Springs Comprehensive High School.
Ownership History
Date
Name
Owned For
Owner Type
Purchase Details
Closed on
Dec 28, 2021
Sold by
Ray Finley Billy
Bought by
Finley Nicholas
Current Estimated Value
Create a Home Valuation Report for This Property
The Home Valuation Report is an in-depth analysis detailing your home's value as well as a comparison with similar homes in the area
Home Values in the Area
Average Home Value in this Area
Purchase History
| Date | Buyer | Sale Price | Title Company |
|---|---|---|---|
| Finley Nicholas | -- | Hartley Rowe & Fowler Pc | |
| Finley Billy Ray | -- | Hartley Rowen & Fowler Pc |
Source: Public Records
Tax History Compared to Growth
Tax History
| Year | Tax Paid | Tax Assessment Tax Assessment Total Assessment is a certain percentage of the fair market value that is determined by local assessors to be the total taxable value of land and additions on the property. | Land | Improvement |
|---|---|---|---|---|
| 2024 | $978 | $31,080 | $9,760 | $21,320 |
| 2023 | $988 | $31,080 | $9,760 | $21,320 |
| 2022 | $656 | $20,160 | $5,560 | $14,600 |
| 2021 | $531 | $16,280 | $5,560 | $10,720 |
| 2020 | $540 | $16,280 | $5,560 | $10,720 |
| 2019 | $497 | $16,040 | $5,560 | $10,480 |
| 2018 | $485 | $15,600 | $5,560 | $10,040 |
| 2017 | $449 | $14,160 | $5,280 | $8,880 |
| 2016 | $412 | $12,760 | $4,880 | $7,880 |
| 2015 | $438 | $12,520 | $4,880 | $7,640 |
| 2014 | $438 | $13,044 | $6,120 | $6,924 |
| 2013 | -- | $13,004 | $6,120 | $6,884 |
Source: Public Records
Map
Nearby Homes
- 0 Mckown Rd Unit 7632191
- 0 Mckown Rd Unit 10583796
- 7146 Old Beulah Rd
- 3916 S Martin Way
- 4319 Parkview Dr
- 6906 Cherry Cir
- 4336 Parkview Dr
- 7104 Miller St
- 2741 Groovers Lake Point
- 2683 Jordan Ln
- 2694 Jordan Ln
- 2694 Jordan Ln Unit 23
- 2623 Jordan Ln
- 2693 Jordan Ln
- Bradley Plan at The View at Groover's Lake - Georgian Series
- Wisteria Plan at The View at Groover's Lake - Georgian Series
- Bayberry Plan at The View at Groover's Lake - Georgian Series
- Redbud Plan at The View at Groover's Lake - Georgian Series
- 4485 Canary Ct
- 4045 Riley Rd
- 3071 Wistful Ct
- 4029 Riley Rd
- 3076 Wistful Ct
- 3081 Wistful Ct
- 4021 Riley Rd
- 3086 Wistful Ct
- 4060 Riley Rd
- 3091 Wistful Ct
- 0 Wistful Ct Unit 7222163
- 0 Wistful Ct
- 930 Riley Estates Dr
- 4082 Riley Rd
- 920 Riley Estates Dr
- 935 Riley Estates Dr
- 910 Riley Estates Dr
- 4120 Riley Rd
- 4090 Riley Rd
- 3017 Bellingham Way
- 900 Riley Estates Dr