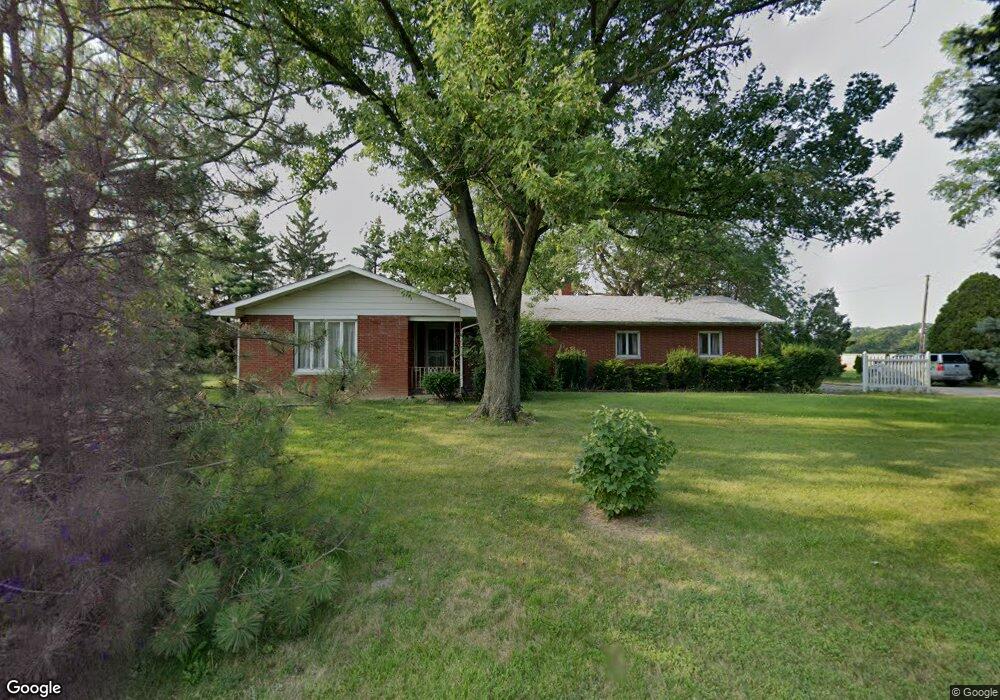
4037 Road 192 Antwerp, OH 45813
Estimated Value: $156,000 - $251,000
3
Beds
2
Baths
1,498
Sq Ft
$131/Sq Ft
Est. Value
About This Home
This home is located at 4037 Road 192, Antwerp, OH 45813 and is currently estimated at $196,263, approximately $131 per square foot. 4037 Road 192 is a home located in Paulding County with nearby schools including Antwerp Local Elementary School and Antwerp Local High School.
Ownership History
Date
Name
Owned For
Owner Type
Purchase Details
Closed on
May 22, 2021
Sold by
Meyer Patrick A and Meyer Edward J
Bought by
Gaisford Tyler P and Gaisford Katelyn L
Current Estimated Value
Home Financials for this Owner
Home Financials are based on the most recent Mortgage that was taken out on this home.
Original Mortgage
$117,826
Outstanding Balance
$106,780
Interest Rate
3.1%
Mortgage Type
FHA
Estimated Equity
$89,483
Purchase Details
Closed on
Oct 15, 2008
Sold by
Livin Meyer Virgil J and Livin Virgil J Meyer Revocable
Bought by
Meyer Virgil J and Myer Dorothy M
Purchase Details
Closed on
Sep 23, 1999
Bought by
Meyer Virgil J Life Estate & Myer Doroth
Purchase Details
Closed on
Jan 1, 1990
Bought by
Meyer Virgil J Life Estate & Myer Doroth
Create a Home Valuation Report for This Property
The Home Valuation Report is an in-depth analysis detailing your home's value as well as a comparison with similar homes in the area
Home Values in the Area
Average Home Value in this Area
Purchase History
| Date | Buyer | Sale Price | Title Company |
|---|---|---|---|
| Gaisford Tyler P | $120,000 | Agility Closing & Title Svcs | |
| Gaisford Tyler P | -- | None Listed On Document | |
| Meyer Virgil J | -- | None Available | |
| Meyer Virgil J Life Estate & Myer Doroth | -- | -- | |
| Meyer Virgil J Life Estate & Myer Doroth | -- | -- |
Source: Public Records
Mortgage History
| Date | Status | Borrower | Loan Amount |
|---|---|---|---|
| Open | Gaisford Tyler P | $117,826 | |
| Closed | Gaisford Tyler P | $117,826 |
Source: Public Records
Tax History Compared to Growth
Tax History
| Year | Tax Paid | Tax Assessment Tax Assessment Total Assessment is a certain percentage of the fair market value that is determined by local assessors to be the total taxable value of land and additions on the property. | Land | Improvement |
|---|---|---|---|---|
| 2024 | $1,454 | $41,970 | $5,010 | $36,960 |
| 2023 | $1,454 | $41,970 | $5,010 | $36,960 |
| 2022 | $1,431 | $41,970 | $5,010 | $36,960 |
| 2021 | $1,535 | $40,890 | $5,010 | $35,880 |
| 2020 | $1,578 | $40,890 | $5,010 | $35,880 |
| 2019 | $1,600 | $36,200 | $5,010 | $31,190 |
| 2018 | $1,030 | $36,200 | $5,010 | $31,190 |
| 2017 | $1,031 | $36,200 | $5,010 | $31,190 |
| 2016 | $1,032 | $36,200 | $5,010 | $31,190 |
| 2015 | $1,028 | $36,930 | $5,010 | $31,920 |
| 2014 | $1,018 | $36,930 | $5,010 | $31,920 |
| 2013 | $1,211 | $38,610 | $5,010 | $33,600 |
Source: Public Records
Map
Nearby Homes
- 136 Maumee Ln
- 3190 Road 204
- 309 N Madison St
- 208 W River St
- 13149 Road 27b
- 5092 Road 176
- 16453 Road 63
- 1258 Road 192
- 26100 Worden Rd
- 24212 River Rd
- TBD Allen Rd
- 25812 Maumee Center Rd
- 11309 State Route 49
- 11234 State Route 49
- 24502 Indiana 37
- 319 W High St
- 217 W Edgerton St
- 110 Sholl Terrace
- 338 Chicago Ave
- 307 Spencerville St
- 4037 Road 192
- 4051 Road 192
- 15413 State Route 49
- 3982 Road 192
- 3816 Road 192
- 15812 State Route 49
- 4422 Road 192
- 15891 State Route 49
- 4504 Road 192
- 4024 Road 204
- 3528 Road 192
- 3601 Road 279
- 3499 Road 279
- Sr 49 and C 204
- SR 49 C 204
- 4706 Road 192
- 4596 Road 192
- 14753 State Route 49
- 14755 State Route 49
- 14745 State Route 49