Estimated Value: $408,882 - $449,000
3
Beds
1
Bath
1,388
Sq Ft
$310/Sq Ft
Est. Value
About This Home
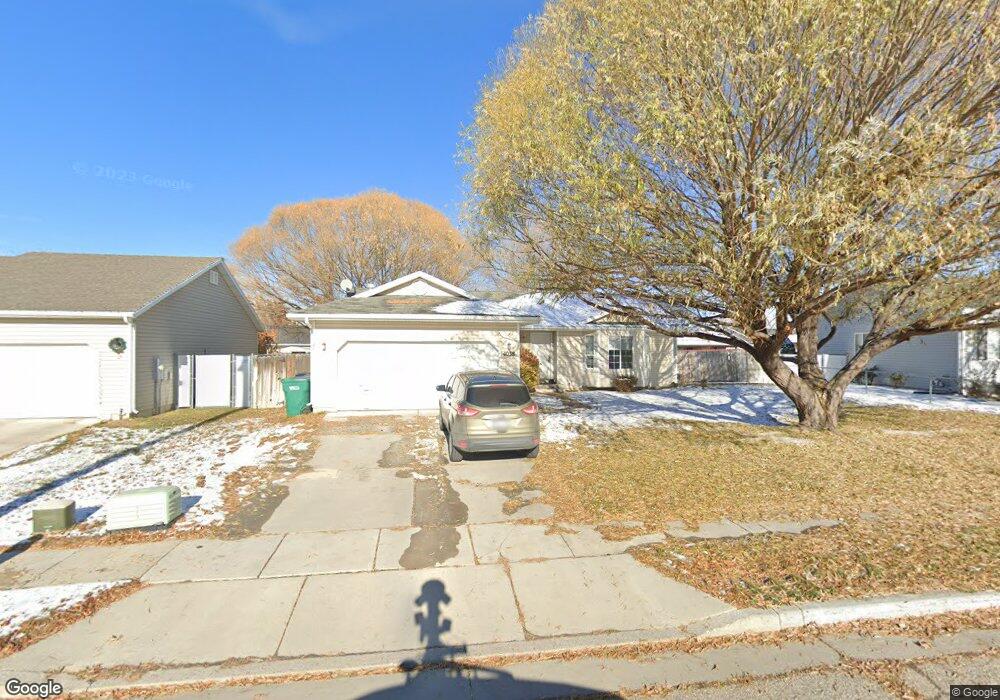
This home is located at 4038 W 5250 S Unit 25, Roy, UT 84067 and is currently estimated at $430,221, approximately $309 per square foot. 4038 W 5250 S Unit 25 is a home located in Weber County with nearby schools including Country View School, Rocky Mountain Junior High School, and Roy High School.
Ownership History
Date
Name
Owned For
Owner Type
Purchase Details
Closed on
Mar 26, 2021
Sold by
Salvo Jennifer Lynn and Salvo Mitchel S
Bought by
Salvo Jennifer Lynn and Salvo Steven Mitchel
Current Estimated Value
Purchase Details
Closed on
Jan 31, 2002
Sold by
Henry Michael
Bought by
Salvo Mitchel S
Home Financials for this Owner
Home Financials are based on the most recent Mortgage that was taken out on this home.
Original Mortgage
$91,200
Interest Rate
6.66%
Purchase Details
Closed on
May 8, 2001
Sold by
Aldous Terry
Bought by
Henry Gene A
Home Financials for this Owner
Home Financials are based on the most recent Mortgage that was taken out on this home.
Original Mortgage
$35,000
Interest Rate
6.89%
Purchase Details
Closed on
Sep 17, 1999
Sold by
Alpine Homes Inc
Bought by
Aldous Terry
Home Financials for this Owner
Home Financials are based on the most recent Mortgage that was taken out on this home.
Original Mortgage
$124,969
Interest Rate
7.89%
Mortgage Type
FHA
Create a Home Valuation Report for This Property
The Home Valuation Report is an in-depth analysis detailing your home's value as well as a comparison with similar homes in the area
Home Values in the Area
Average Home Value in this Area
Purchase History
| Date | Buyer | Sale Price | Title Company |
|---|---|---|---|
| Salvo Jennifer Lynn | -- | None Available | |
| Salvo Mitchel S | -- | Mountain View Title | |
| Henry Gene A | -- | First American Title Insuran | |
| Aldous Terry | -- | First American Title |
Source: Public Records
Mortgage History
| Date | Status | Borrower | Loan Amount |
|---|---|---|---|
| Closed | Salvo Mitchel S | $91,200 | |
| Previous Owner | Henry Gene A | $35,000 | |
| Previous Owner | Aldous Terry | $124,969 |
Source: Public Records
Tax History Compared to Growth
Tax History
| Year | Tax Paid | Tax Assessment Tax Assessment Total Assessment is a certain percentage of the fair market value that is determined by local assessors to be the total taxable value of land and additions on the property. | Land | Improvement |
|---|---|---|---|---|
| 2025 | $4,553 | $416,064 | $128,561 | $287,503 |
| 2024 | $4,403 | $405,000 | $128,561 | $276,439 |
| 2023 | $4,388 | $405,000 | $121,353 | $283,647 |
| 2022 | $2,600 | $430,000 | $107,160 | $322,840 |
| 2021 | $2,040 | $303,000 | $81,562 | $221,438 |
| 2020 | $1,974 | $270,000 | $81,562 | $188,438 |
| 2019 | $1,876 | $241,000 | $46,247 | $194,753 |
| 2018 | $1,796 | $217,000 | $43,303 | $173,697 |
| 2017 | $1,667 | $188,000 | $43,303 | $144,697 |
| 2016 | $1,589 | $96,215 | $22,430 | $73,785 |
| 2015 | $1,428 | $87,910 | $22,430 | $65,480 |
| 2014 | $1,375 | $83,344 | $19,696 | $63,648 |
Source: Public Records
Map
Nearby Homes
- 5235 Midland Dr
- 4021 W 5000 S
- 4990 S 4075 W
- 5270 S 4200 W
- 4218 W 5050 S
- 5013 S 4150 W
- 4890 S 4075 W
- 3820 Foxglen Dr
- 4141 W 4875 S
- 5116 S 4300 W
- 4106 W 4875 S
- 3766 W 5300 S
- 5465 S 4050 W
- 4097 W 4750 S
- 4337 W 5430 S Unit A
- 4094 W 4700 S
- 4309 W 5430 St #B S
- 4342 W 5430 S Unit B
- 5539 S 4175 W
- Poplar Plan at Highgate Cove
- 4038 W 5250 S
- 4052 W 5250 S
- 4052 W 5250 S Unit 24
- 4032 W 5250 S
- 4053 W 5075 S
- 4041 W 5075 S
- 4064 W 5250 S
- 4064 W 5250 S Unit 23
- 4018 W 5250 S Unit 27
- 4073 W 5075 S
- 4027 W 5075 S
- 4028 W 5300 S
- 4028 W 5300 S Unit 43
- 4055 W 5250 S
- 4055 W 5250 S Unit 45
- 4085 W 5075 S
- 4015 W 5075 S
- 4070 W 5250 S
- 4042 W 5300 S
- 4042 W 5300 S Unit 44