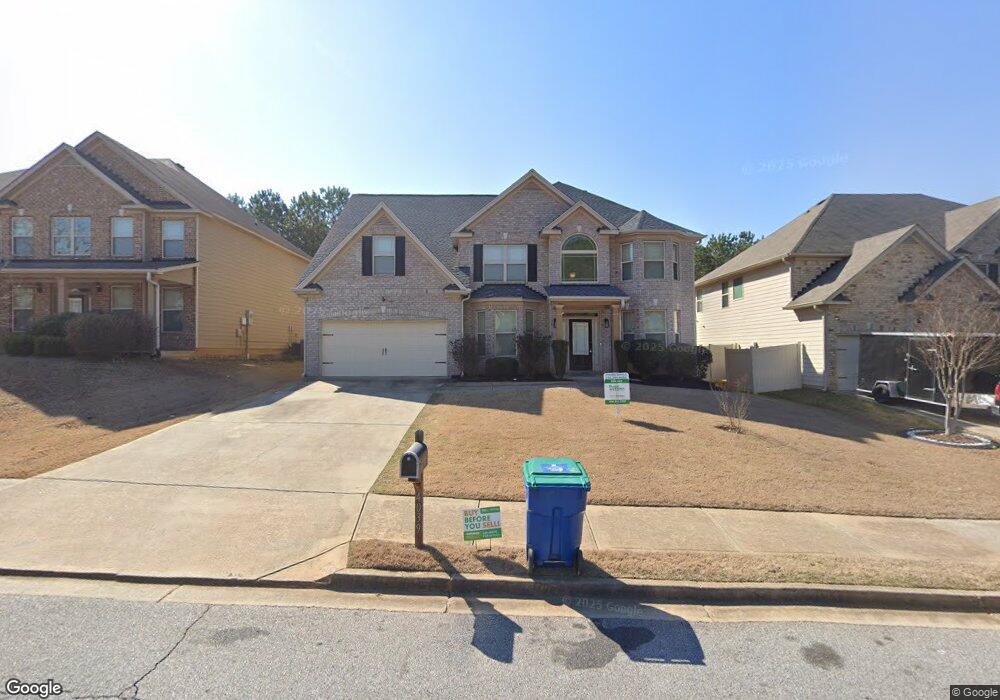
4039 Dinmont Chase Unit 187 Atlanta, GA 30349
Estimated Value: $420,000 - $432,000
4
Beds
3
Baths
3,132
Sq Ft
$137/Sq Ft
Est. Value
About This Home
This home is located at 4039 Dinmont Chase Unit 187, Atlanta, GA 30349 and is currently estimated at $428,119, approximately $136 per square foot. 4039 Dinmont Chase Unit 187 is a home located in Fulton County with nearby schools including Wolf Creek Elementary, Sandtown Middle School, and Langston Hughes High School.
Ownership History
Date
Name
Owned For
Owner Type
Purchase Details
Closed on
Apr 23, 2025
Sold by
Echols Ayanna
Bought by
Cooper Marc Antonie
Current Estimated Value
Home Financials for this Owner
Home Financials are based on the most recent Mortgage that was taken out on this home.
Original Mortgage
$10,000
Outstanding Balance
$9,287
Interest Rate
6.65%
Mortgage Type
New Conventional
Estimated Equity
$418,832
Purchase Details
Closed on
Nov 26, 2013
Sold by
Peachtree Communities At P
Bought by
Echols Ayanna
Home Financials for this Owner
Home Financials are based on the most recent Mortgage that was taken out on this home.
Original Mortgage
$215,209
Interest Rate
4.4%
Mortgage Type
FHA
Purchase Details
Closed on
Feb 22, 2013
Sold by
Moja Opportunity Fund Llc
Bought by
Peachtree Communities At Pittm
Create a Home Valuation Report for This Property
The Home Valuation Report is an in-depth analysis detailing your home's value as well as a comparison with similar homes in the area
Home Values in the Area
Average Home Value in this Area
Purchase History
| Date | Buyer | Sale Price | Title Company |
|---|---|---|---|
| Cooper Marc Antonie | $422,000 | -- | |
| Echols Ayanna | $219,180 | -- | |
| Peachtree Communities At Pittm | $124,000 | -- |
Source: Public Records
Mortgage History
| Date | Status | Borrower | Loan Amount |
|---|---|---|---|
| Open | Cooper Marc Antonie | $10,000 | |
| Open | Cooper Marc Antonie | $422,000 | |
| Previous Owner | Echols Ayanna | $215,209 | |
| Previous Owner | Echols Ayanna | $7,500 |
Source: Public Records
Tax History Compared to Growth
Tax History
| Year | Tax Paid | Tax Assessment Tax Assessment Total Assessment is a certain percentage of the fair market value that is determined by local assessors to be the total taxable value of land and additions on the property. | Land | Improvement |
|---|---|---|---|---|
| 2025 | $3,303 | $177,040 | $31,640 | $145,400 |
| 2023 | $3,303 | $172,440 | $32,720 | $139,720 |
| 2022 | $3,119 | $132,960 | $27,040 | $105,920 |
| 2021 | $3,073 | $129,080 | $26,240 | $102,840 |
| 2020 | $3,077 | $127,520 | $25,920 | $101,600 |
| 2019 | $3,133 | $106,520 | $12,680 | $93,840 |
| 2018 | $3,332 | $104,040 | $12,400 | $91,640 |
| 2017 | $2,866 | $87,400 | $14,200 | $73,200 |
| 2016 | $2,865 | $87,400 | $14,200 | $73,200 |
| 2015 | $2,874 | $87,400 | $14,200 | $73,200 |
| 2014 | $3,016 | $87,670 | $11,870 | $75,800 |
Source: Public Records
Map
Nearby Homes
- 4349 Sublime Trail
- 4027 Dinmont Chase
- 4300 Watauga Dr
- 5849 Harrier Ln
- 617 Maltese Dr
- 5688 Baffin Rd
- 5530 Rosehall Place
- 4081 Trimrose Ct
- 4077 Trimrose Ct
- 5611 Rosehall Place Unit 181
- 5611 Rosehall Place
- 5615 Rosehall Place
- 5615 Rosehall Place Unit LOT 182
- Sapling Plan at Parkview Estates
- Birch Plan at Parkview Estates
- Guava Plan at Parkview Estates
- Travis Plan at Parkview Estates
- Atlas Plan at Parkview Estates
- Fontana Plan at Parkview Estates
- Harding Plan at Parkview Estates
- 4035 Dinmont Chase
- 4035 Dinmont Chase Unit 186
- 4043 Dinmont Chase
- 4051 Dinmont Chase
- 4051 Dinmont Chase Unit 189
- 4031 Dinmont Chase
- 4031 Dinmont Chase Unit 185
- 0 Sublime Trail Unit 8136644
- 0 Sublime Trail Unit 8651775
- 0 Sublime Trail Unit 8810986
- 0 Sublime Trail Unit 8863401
- 0 Sublime Trail Unit 8897770
- 0 Sublime Trail Unit 3263456
- 0 Sublime Trail Unit 3263609
- 0 Sublime Trail Unit 3279141
- 0 Sublime Trail Unit 7452916
- 0 Sublime Trail Unit 7554483
- 0 Sublime Trail Unit 7569971
- 0 Sublime Trail Unit 7578575
- 0 Sublime Trail Unit 7585920