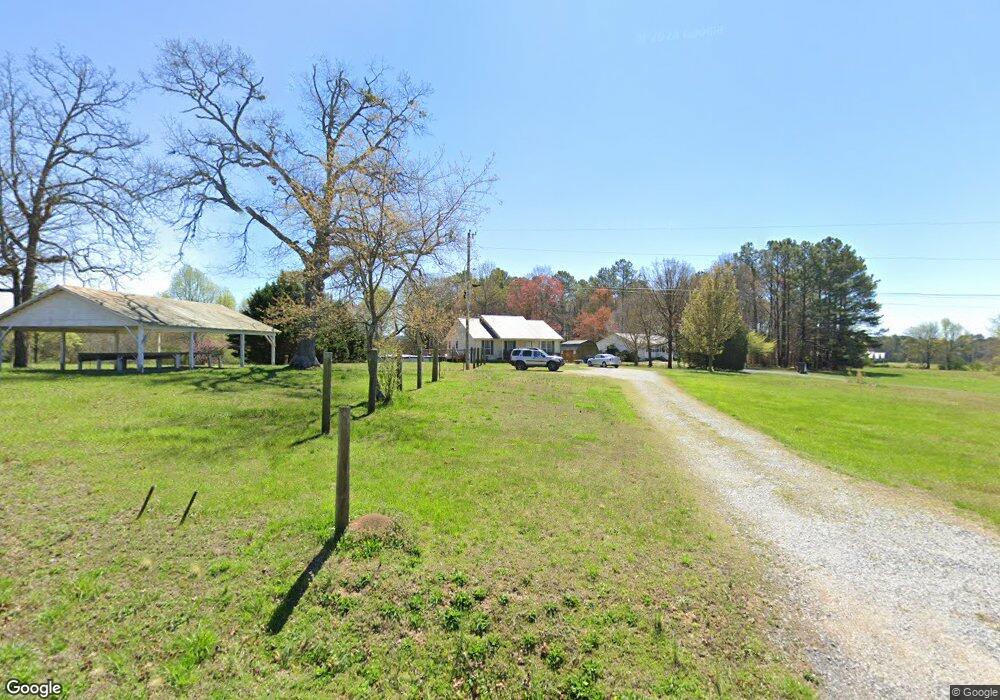
4039 Dunnagan Rd Rocky Face, GA 30740
Estimated Value: $206,679 - $308,000
--
Bed
2
Baths
1,260
Sq Ft
$204/Sq Ft
Est. Value
About This Home
This home is located at 4039 Dunnagan Rd, Rocky Face, GA 30740 and is currently estimated at $256,560, approximately $203 per square foot. 4039 Dunnagan Rd is a home located in Whitfield County with nearby schools including Westside Elementary School, Westside Middle School, and Northwest Whitfield County High School.
Ownership History
Date
Name
Owned For
Owner Type
Purchase Details
Closed on
Jun 2, 2006
Sold by
Lancaster Amy Ellen
Bought by
Stubbs Amy Ellen
Current Estimated Value
Home Financials for this Owner
Home Financials are based on the most recent Mortgage that was taken out on this home.
Original Mortgage
$112,000
Outstanding Balance
$65,626
Interest Rate
6.51%
Mortgage Type
New Conventional
Estimated Equity
$190,935
Purchase Details
Closed on
Feb 17, 2005
Sold by
Not Provided
Bought by
Stubbs Amy Ellen and Stubbs Jackie R
Home Financials for this Owner
Home Financials are based on the most recent Mortgage that was taken out on this home.
Original Mortgage
$122,000
Interest Rate
8.9%
Mortgage Type
New Conventional
Purchase Details
Closed on
Aug 8, 2000
Sold by
Lancaster Damion A and Lancaster Amy R
Bought by
Lancaster Amy Ellen
Purchase Details
Closed on
Oct 1, 1998
Bought by
Lancaster Damion A and Lancaster Amy R
Create a Home Valuation Report for This Property
The Home Valuation Report is an in-depth analysis detailing your home's value as well as a comparison with similar homes in the area
Home Values in the Area
Average Home Value in this Area
Purchase History
| Date | Buyer | Sale Price | Title Company |
|---|---|---|---|
| Stubbs Amy Ellen | -- | -- | |
| Stubbs Amy Ellen | -- | -- | |
| Lancaster Amy Ellen | -- | -- | |
| Lancaster Damion A | -- | -- |
Source: Public Records
Mortgage History
| Date | Status | Borrower | Loan Amount |
|---|---|---|---|
| Open | Stubbs Amy Ellen | $112,000 | |
| Previous Owner | Stubbs Amy Ellen | $122,000 |
Source: Public Records
Tax History Compared to Growth
Tax History
| Year | Tax Paid | Tax Assessment Tax Assessment Total Assessment is a certain percentage of the fair market value that is determined by local assessors to be the total taxable value of land and additions on the property. | Land | Improvement |
|---|---|---|---|---|
| 2024 | $1,304 | $76,636 | $10,763 | $65,873 |
| 2023 | $1,304 | $48,368 | $8,477 | $39,891 |
| 2022 | $825 | $36,528 | $7,443 | $29,085 |
| 2021 | $825 | $36,528 | $7,443 | $29,085 |
| 2020 | $842 | $36,528 | $7,443 | $29,085 |
| 2019 | $850 | $36,528 | $7,443 | $29,085 |
| 2018 | $816 | $35,185 | $6,100 | $29,085 |
| 2017 | $816 | $35,185 | $6,100 | $29,085 |
| 2016 | $718 | $32,553 | $6,100 | $26,453 |
| 2014 | $781 | $36,399 | $9,946 | $26,453 |
| 2013 | -- | $36,399 | $9,946 | $26,453 |
Source: Public Records
Map
Nearby Homes
- 4125 Dunnagan Rd
- 0 Freeman Springs Rd Unit 121469
- 1446 Lafayette Rd
- 1005 Robin Way
- 35 acres Lafayette Rd
- 0 Lafayette Unit 131389
- Tract 1 A & B I-75 Beavers Rd
- 35 Acres Lafayette Rd
- 967 Lafayette Rd
- 1461 Houston Valley Rd
- 2335 Coley Farm Rd
- 1400 Dogwood Valley Rd
- 539 Vaughn Dr
- 2386 Utility Rd
- 1616 Houston Valley Rd
- 110 Windy Hill Dr
- 2015 Westin Way
- 2950 Davis Rd
- 2906 Davis Rd
- 3365 Crider Rd
- 4041 Dunnagan Rd
- 4029 Dunnagan Rd
- 1828 Quinton Rd
- 4079 Dunnagan Rd
- 4001 Dunnagan Rd
- 4080 Dunnagan Rd
- 194 Birdhouse Way
- 194 Birdhouse Way
- 1726 Quinton Rd
- 4115 Dunnagan Rd
- 4000 Dunnagan Rd
- 1819 Quinton Rd
- 131 Birdhouse Way
- 1733 Quinton Rd
- 131 Birdhouse Way
- 1737 Quinton Rd
- 1940 Quinton Rd
- 3955 Dunnagan Rd
- 3986 Dunnagan Rd
- LOT 1 Trickum Rd