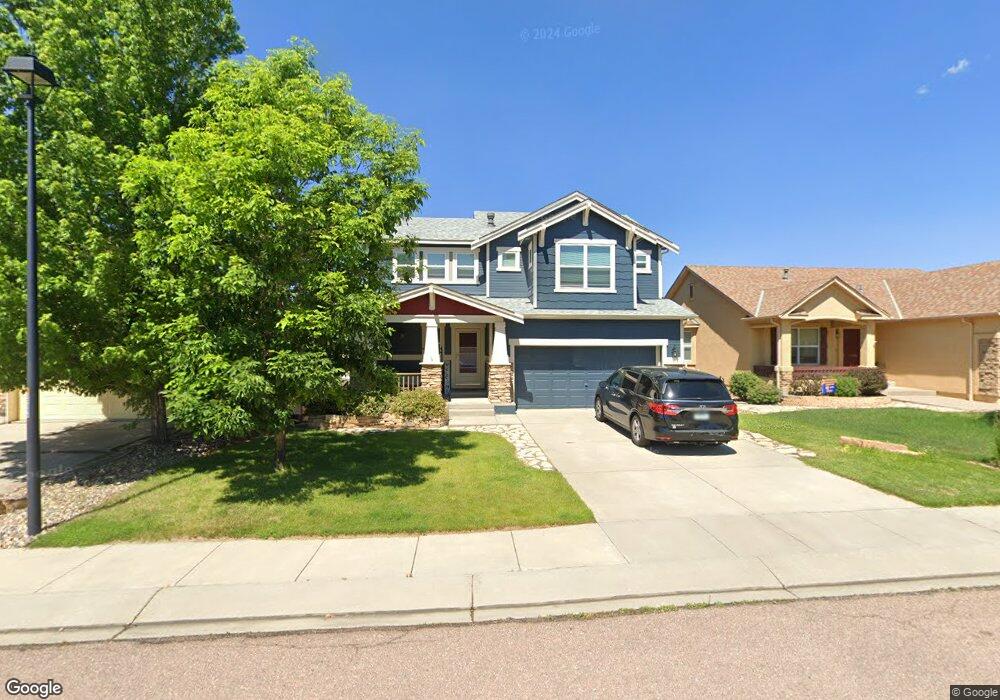
4039 Morning Glory Rd Colorado Springs, CO 80920
Briargate NeighborhoodEstimated Value: $511,974 - $561,000
4
Beds
4
Baths
1,551
Sq Ft
$346/Sq Ft
Est. Value
About This Home
This home is located at 4039 Morning Glory Rd, Colorado Springs, CO 80920 and is currently estimated at $535,994, approximately $345 per square foot. 4039 Morning Glory Rd is a home located in El Paso County with nearby schools including Explorer Elementary School, Timberview Middle School, and Liberty High School.
Ownership History
Date
Name
Owned For
Owner Type
Purchase Details
Closed on
Jul 7, 2014
Sold by
Ours Daniel Lee and Ours Loretta Jo
Bought by
Garn Damon M and Garn Emily J
Current Estimated Value
Home Financials for this Owner
Home Financials are based on the most recent Mortgage that was taken out on this home.
Original Mortgage
$289,750
Outstanding Balance
$220,951
Interest Rate
4.19%
Mortgage Type
New Conventional
Estimated Equity
$315,043
Purchase Details
Closed on
Dec 29, 2011
Sold by
Ours Daniel L and Ours Loretta J
Bought by
Ours Daniel Lee and Ours Loretta Jo
Purchase Details
Closed on
May 27, 2005
Sold by
Elite Properties Of America Inc
Bought by
Ours Daniel L and Ours Loretta J
Home Financials for this Owner
Home Financials are based on the most recent Mortgage that was taken out on this home.
Original Mortgage
$210,000
Interest Rate
5.83%
Mortgage Type
Fannie Mae Freddie Mac
Create a Home Valuation Report for This Property
The Home Valuation Report is an in-depth analysis detailing your home's value as well as a comparison with similar homes in the area
Home Values in the Area
Average Home Value in this Area
Purchase History
| Date | Buyer | Sale Price | Title Company |
|---|---|---|---|
| Garn Damon M | $305,000 | Unified Title Company | |
| Ours Daniel Lee | -- | None Available | |
| Ours Daniel L | $300,900 | -- |
Source: Public Records
Mortgage History
| Date | Status | Borrower | Loan Amount |
|---|---|---|---|
| Open | Garn Damon M | $289,750 | |
| Previous Owner | Ours Daniel L | $210,000 |
Source: Public Records
Tax History Compared to Growth
Tax History
| Year | Tax Paid | Tax Assessment Tax Assessment Total Assessment is a certain percentage of the fair market value that is determined by local assessors to be the total taxable value of land and additions on the property. | Land | Improvement |
|---|---|---|---|---|
| 2025 | $2,104 | $35,380 | -- | -- |
| 2024 | $2,067 | $36,540 | $6,700 | $29,840 |
| 2023 | $2,067 | $36,540 | $6,700 | $29,840 |
| 2022 | $1,853 | $26,260 | $5,420 | $20,840 |
| 2021 | $2,050 | $27,020 | $5,580 | $21,440 |
| 2020 | $1,971 | $24,220 | $4,650 | $19,570 |
| 2019 | $1,951 | $24,220 | $4,650 | $19,570 |
| 2018 | $1,761 | $21,500 | $3,600 | $17,900 |
| 2017 | $1,755 | $21,500 | $3,600 | $17,900 |
| 2016 | $1,960 | $23,980 | $3,660 | $20,320 |
| 2015 | $1,956 | $23,980 | $3,660 | $20,320 |
| 2014 | $1,847 | $22,620 | $3,660 | $18,960 |
Source: Public Records
Map
Nearby Homes
- 8845 Nantucket Ct
- 4328 Bays Water Dr
- 9045 Aldersgate Ct
- 9247 Prairie Clover Dr
- 9075 Bellcove Cir
- 3925 Zurich Dr
- 8735 Quail Glen Dr
- 3830 Cottage Dr
- 8674 Bellcove Cir
- 4405 Kashmire Dr
- 4265 Apple Hill Ct
- 4545 Bays Water Dr
- 4267 Purple Plum Way
- 4652 Kashmire Dr
- 9533 Newport Plum Ct
- 4658 Kashmire Dr
- 4585 Kashmire Dr
- 4533 Kashmire Dr
- 9571 Sycamore Glen Trail
- 8702 Alpine Valley Dr
- 4031 Morning Glory Rd
- 4047 Morning Glory Rd
- 4055 Morning Glory Rd
- 4023 Morning Glory Rd
- 4063 Morning Glory Rd
- 4046 Morning Glory Rd
- 4054 Morning Glory Rd
- 4015 Morning Glory Rd
- 4071 Morning Glory Rd
- 4062 Morning Glory Rd
- 4014 Morning Glory Rd
- 4070 Morning Glory Rd
- 4079 Morning Glory Rd
- 4159 Bays Water Dr
- 4151 Bays Water Dr
- 4167 Bays Water Dr
- 4175 Bays Water Dr
- 4078 Morning Glory Rd
- 4183 Bays Water Dr
- 4087 Morning Glory Rd