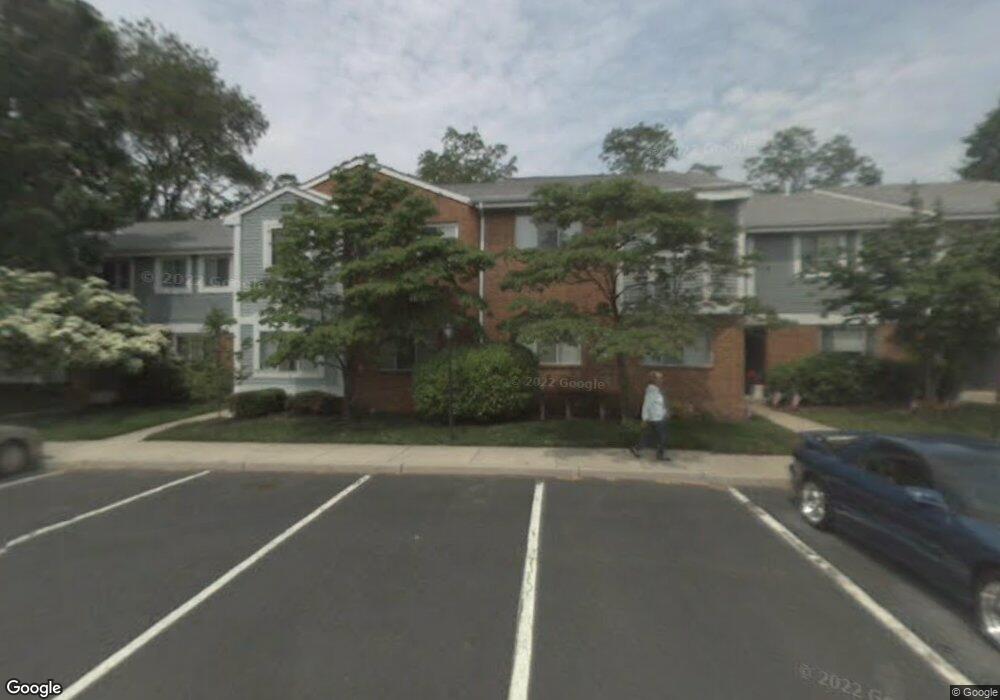
403B Mulberry Cove Mount Laurel, NJ 08054
Ramblewood NeighborhoodEstimated Value: $216,000 - $227,000
--
Bed
--
Bath
884
Sq Ft
$250/Sq Ft
Est. Value
About This Home
This home is located at 403B Mulberry Cove, Mount Laurel, NJ 08054 and is currently estimated at $221,001, approximately $250 per square foot. 403B Mulberry Cove is a home located in Burlington County with nearby schools including Parkway Elementary School, T.E. Harrington Middle School, and Mount Laurel Hartford School.
Ownership History
Date
Name
Owned For
Owner Type
Purchase Details
Closed on
Mar 27, 2025
Sold by
Rsj Real Estate Holdings Llc
Bought by
Chandola Pramod and Chandola Varsha
Current Estimated Value
Purchase Details
Closed on
Dec 14, 2024
Sold by
Heise Roanne I and Longo Robert
Bought by
Rsj Real Estate Holdings Llc
Purchase Details
Closed on
Dec 2, 2022
Sold by
Halgas Daniel O
Bought by
Da Graca Tanya
Home Financials for this Owner
Home Financials are based on the most recent Mortgage that was taken out on this home.
Original Mortgage
$176,000
Interest Rate
6.95%
Mortgage Type
New Conventional
Purchase Details
Closed on
Jul 12, 1984
Bought by
Heise Roanne
Create a Home Valuation Report for This Property
The Home Valuation Report is an in-depth analysis detailing your home's value as well as a comparison with similar homes in the area
Home Values in the Area
Average Home Value in this Area
Purchase History
| Date | Buyer | Sale Price | Title Company |
|---|---|---|---|
| Chandola Pramod | $220,000 | Surety Title | |
| Chandola Pramod | $220,000 | Surety Title | |
| Rsj Real Estate Holdings Llc | $100,000 | None Listed On Document | |
| Rsj Real Estate Holdings Llc | $100,000 | None Listed On Document | |
| Da Graca Tanya | $220,000 | Core Title | |
| Da Graca Tanya | $220,000 | Core Title | |
| Heise Roanne | $50,700 | -- |
Source: Public Records
Mortgage History
| Date | Status | Borrower | Loan Amount |
|---|---|---|---|
| Previous Owner | Da Graca Tanya | $176,000 |
Source: Public Records
Tax History Compared to Growth
Tax History
| Year | Tax Paid | Tax Assessment Tax Assessment Total Assessment is a certain percentage of the fair market value that is determined by local assessors to be the total taxable value of land and additions on the property. | Land | Improvement |
|---|---|---|---|---|
| 2025 | $3,144 | $99,600 | $25,000 | $74,600 |
| 2024 | $3,026 | $99,600 | $25,000 | $74,600 |
| 2023 | $3,026 | $99,600 | $25,000 | $74,600 |
| 2022 | $3,016 | $99,600 | $25,000 | $74,600 |
| 2021 | $2,752 | $99,600 | $25,000 | $74,600 |
| 2020 | $2,901 | $99,600 | $25,000 | $74,600 |
| 2019 | $2,871 | $99,600 | $25,000 | $74,600 |
| 2018 | $2,850 | $99,600 | $25,000 | $74,600 |
| 2017 | $2,776 | $99,600 | $25,000 | $74,600 |
| 2016 | $2,734 | $99,600 | $25,000 | $74,600 |
| 2015 | $2,702 | $99,600 | $25,000 | $74,600 |
| 2014 | $2,675 | $99,600 | $25,000 | $74,600 |
Source: Public Records
Map
Nearby Homes
- 605 605 Augusta Cir
- 605 Augusta Cir Unit 605
- 706 Augusta Cir Unit 706
- 317 Saint David Dr
- 266 Saint David Dr
- 102 Union Mill Terrace
- 223 Saint David Dr
- 109 Yorktown Dr
- 32 Hearthstone Ln
- 303 Woodhollow Dr Unit 303
- 307 Woodhollow Dr
- 706 Woodhollow Dr Unit 706
- 607 Woodhollow Dr
- 1506 Woodhollow Dr Unit 1506
- 1704 Woodhollow Dr Unit 1704
- 1701 Woodhollow Dr
- 9 Candlewood Cir
- 31 Quince Ct
- 23 Emory Ln
- 0 Atrium Way
- 402B Mulberry Cove Unit 402B Mulberry Cove
- 402B Mulberry Cove Unit 402B
- 401A Mulberry Cove
- 402 Mulberry Cove Unit A
- 402 Mulberry Cove
- 401B Mulberry Cove
- 401 Mulberry Cove
- 403 Mulberry Cove
- 403A Mulberry Cove
- 404B Mulberry Cove Unit 404B
- 404A Mulberry Cove
- 404 Mulberry Cove B
- 405B Mulberry Cove Unit 2ND FL
- 405 Mulberry Cove
- 405B Mulberry Cove
- 406B Mulberry Cove Unit 2101
- 406A Mulberry Cove Unit 406A
- 405A Mulberry Cove
- 406 Mulberry Cove
- 506B Mulberry Cove Unit 506B