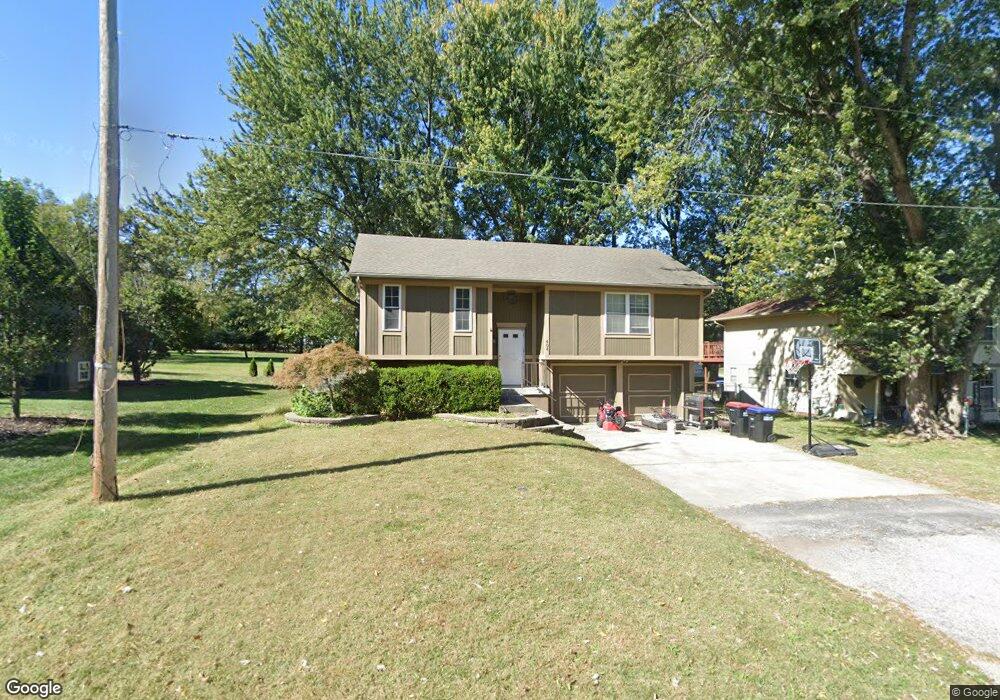
404 8th Ave S Greenwood, MO 64034
Estimated Value: $240,381 - $340,000
3
Beds
2
Baths
1,028
Sq Ft
$270/Sq Ft
Est. Value
About This Home
This home is located at 404 8th Ave S, Greenwood, MO 64034 and is currently estimated at $277,345, approximately $269 per square foot. 404 8th Ave S is a home located in Jackson County with nearby schools including Greenwood Elementary School, Summit Lakes Middle School, and Lee's Summit West High School.
Ownership History
Date
Name
Owned For
Owner Type
Purchase Details
Closed on
Oct 26, 2005
Sold by
Metro Real Estate Corp
Bought by
Niemeyer Erin M
Current Estimated Value
Home Financials for this Owner
Home Financials are based on the most recent Mortgage that was taken out on this home.
Original Mortgage
$121,985
Outstanding Balance
$65,867
Interest Rate
5.9%
Mortgage Type
Purchase Money Mortgage
Estimated Equity
$211,478
Purchase Details
Closed on
Aug 16, 2004
Sold by
Johnson Heather J and Johnson Sean P
Bought by
Metro Real Estate Corp
Purchase Details
Closed on
Oct 23, 2000
Sold by
Vincent Bernard
Bought by
Bales Heather Joy
Purchase Details
Closed on
Mar 20, 1996
Sold by
Kreissler Troy A and Kreissler Kelly
Bought by
Bales Bernard and Bales Heather J
Home Financials for this Owner
Home Financials are based on the most recent Mortgage that was taken out on this home.
Original Mortgage
$71,932
Interest Rate
7.02%
Mortgage Type
FHA
Create a Home Valuation Report for This Property
The Home Valuation Report is an in-depth analysis detailing your home's value as well as a comparison with similar homes in the area
Home Values in the Area
Average Home Value in this Area
Purchase History
| Date | Buyer | Sale Price | Title Company |
|---|---|---|---|
| Niemeyer Erin M | -- | Ctic | |
| Metro Real Estate Corp | -- | Ctic | |
| Bales Heather Joy | -- | Ctic | |
| Bales Heather Joy | -- | -- | |
| Bales Bernard | -- | -- |
Source: Public Records
Mortgage History
| Date | Status | Borrower | Loan Amount |
|---|---|---|---|
| Open | Niemeyer Erin M | $121,985 | |
| Previous Owner | Bales Bernard | $71,932 |
Source: Public Records
Tax History Compared to Growth
Tax History
| Year | Tax Paid | Tax Assessment Tax Assessment Total Assessment is a certain percentage of the fair market value that is determined by local assessors to be the total taxable value of land and additions on the property. | Land | Improvement |
|---|---|---|---|---|
| 2025 | $2,110 | $34,174 | $5,037 | $29,137 |
| 2024 | $2,089 | $30,524 | $3,623 | $26,901 |
| 2023 | $2,089 | $30,523 | $2,390 | $28,133 |
| 2022 | $2,008 | $25,840 | $3,468 | $22,372 |
| 2021 | $2,054 | $25,840 | $3,468 | $22,372 |
| 2020 | $1,981 | $24,513 | $3,468 | $21,045 |
| 2019 | $1,947 | $24,513 | $3,468 | $21,045 |
| 2018 | $1,786 | $20,814 | $3,044 | $17,770 |
| 2017 | $1,786 | $20,814 | $3,044 | $17,770 |
| 2016 | $1,786 | $20,292 | $722 | $19,570 |
| 2014 | $1,841 | $20,433 | $672 | $19,761 |
Source: Public Records
Map
Nearby Homes
- 202 6th Ave S
- 1106 Huntington Ln
- 1107 Huntington Ln
- 1210 Huntington Ln
- 701 16th Ave S
- 1301 Meadows Ln
- 704 16th Ave S
- 405 17th Ave S
- 105 17th Ave S
- 403 Ridgeway Dr
- 1104 16th Ave S
- 810 Tabitha Ln
- 1803 Brent Ln
- 1306 Dogwood Dr
- 1900 Blackfoot Ct
- 1505 Rolling Dr
- 1208 Bradford Dr
- 202 20th Ave S
- 500 Grant Ave S
- 1904 Gambrell St