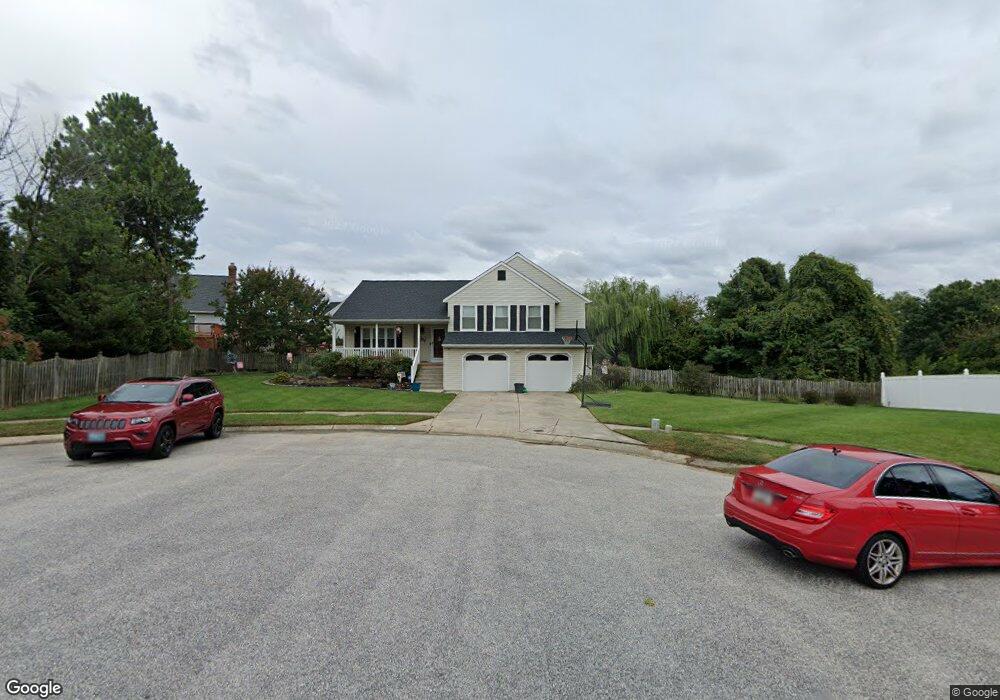
404 Applegate Ct Linthicum Heights, MD 21090
Estimated Value: $570,395 - $683,000
Studio
3
Baths
2,310
Sq Ft
$263/Sq Ft
Est. Value
About This Home
This home is located at 404 Applegate Ct, Linthicum Heights, MD 21090 and is currently estimated at $606,849, approximately $262 per square foot. 404 Applegate Ct is a home located in Anne Arundel County with nearby schools including Linthicum Elementary School, Lindale Middle School, and North County High School.
Ownership History
Date
Name
Owned For
Owner Type
Purchase Details
Closed on
Sep 30, 2013
Sold by
Ward Kimberly F
Bought by
Zerhusen Leo A and Zerhusen Stephanie M
Current Estimated Value
Home Financials for this Owner
Home Financials are based on the most recent Mortgage that was taken out on this home.
Original Mortgage
$265,000
Outstanding Balance
$199,359
Interest Rate
4.53%
Mortgage Type
Purchase Money Mortgage
Estimated Equity
$407,490
Purchase Details
Closed on
Feb 9, 2001
Sold by
Ward Randy A
Bought by
Ward Kimberly F
Purchase Details
Closed on
May 14, 1992
Sold by
Shipley Fairmount Corp
Bought by
Ward Randy A
Home Financials for this Owner
Home Financials are based on the most recent Mortgage that was taken out on this home.
Original Mortgage
$174,800
Interest Rate
8.75%
Create a Home Valuation Report for This Property
The Home Valuation Report is an in-depth analysis detailing your home's value as well as a comparison with similar homes in the area
Home Values in the Area
Average Home Value in this Area
Purchase History
| Date | Buyer | Sale Price | Title Company |
|---|---|---|---|
| Zerhusen Leo A | $360,000 | Lakeside Title Company | |
| Ward Kimberly F | -- | -- | |
| Ward Randy A | $184,300 | -- |
Source: Public Records
Mortgage History
| Date | Status | Borrower | Loan Amount |
|---|---|---|---|
| Open | Zerhusen Leo A | $265,000 | |
| Previous Owner | Ward Randy A | $174,800 |
Source: Public Records
Tax History
| Year | Tax Paid | Tax Assessment Tax Assessment Total Assessment is a certain percentage of the fair market value that is determined by local assessors to be the total taxable value of land and additions on the property. | Land | Improvement |
|---|---|---|---|---|
| 2025 | $5,244 | $500,800 | $193,100 | $307,700 |
| 2024 | $5,244 | $476,600 | $0 | $0 |
| 2023 | $5,093 | $452,400 | $0 | $0 |
| 2022 | $4,748 | $428,200 | $173,100 | $255,100 |
| 2020 | $4,530 | $401,200 | $0 | $0 |
| 2019 | $4,446 | $387,700 | $153,000 | $234,700 |
| 2018 | $3,861 | $380,800 | $0 | $0 |
| 2017 | $4,193 | $373,900 | $0 | $0 |
| 2016 | -- | $367,000 | $0 | $0 |
| 2015 | -- | $367,000 | $0 | $0 |
| 2014 | -- | $367,000 | $0 | $0 |
Source: Public Records
Map
Nearby Homes
- 602 S Hammonds Ferry Rd
- 607 Brentwood Rd
- 533 Forest View Rd
- 520 Cleveland Rd
- 534 Cleveland Rd
- 526 Hawthorne Rd
- 319 School Ln
- 612 Fairmount Rd
- 237 Poplar Ave
- 763 Hawthorne Rd
- 1103 Rosedale Ave
- 102 Catalpa Rd
- 404 Homewood Rd
- 314 Church Cir
- 102 Poplar Ave
- 413 Elm Ave
- 114 2nd Ave N
- 109 1st Ave W
- 312 N Hammonds Ferry Rd
- 103 Andel Ct
- 605 Fairmeade Ct
- 606 Fairmeade Ct
- 406 Applegate Ct
- 402 Applegate Ct
- 603 Fairmeade Ct
- 604 Fairmeade Ct
- 408 Applegate Ct
- 400 Applegate Ct
- 401 Applegate Ct
- 403 Applegate Ct
- 602 Fairmeade Ct
- 405 Applegate Ct
- 601 Fairmeade Ct
- 410 Applegate Ct
- 605 Eagles Wing Ct
- 407 Applegate Ct
- 600 Fairmeade Ct
- 603 Eagles Wing Ct
- 412 Applegate Ct
- 729 S Hammonds Ferry Rd
Your Personal Tour Guide
Ask me questions while you tour the home.