404 Arnies Loop Cape Charles, VA 23310
Estimated Value: $920,000 - $1,267,000
4
Beds
5
Baths
4,230
Sq Ft
$260/Sq Ft
Est. Value
About This Home
This home is located at 404 Arnies Loop, Cape Charles, VA 23310 and is currently estimated at $1,098,164, approximately $259 per square foot. 404 Arnies Loop is a home located in Northampton County with nearby schools including Northampton High School and Cape Charles Christian School.
Ownership History
Date
Name
Owned For
Owner Type
Purchase Details
Closed on
Dec 18, 2021
Sold by
Even Bryan J and Even Sandra L
Bought by
Bryan J Even Revocable Trust and Sandra L Even Revocable Trust
Current Estimated Value
Home Financials for this Owner
Home Financials are based on the most recent Mortgage that was taken out on this home.
Original Mortgage
$109,000
Outstanding Balance
$99,230
Interest Rate
3.12%
Estimated Equity
$998,934
Purchase Details
Closed on
Nov 9, 2021
Sold by
Hitchings Virginia B and The William L Hitchings Living
Bought by
Even Bryan J and Even Sandra L
Home Financials for this Owner
Home Financials are based on the most recent Mortgage that was taken out on this home.
Original Mortgage
$109,000
Outstanding Balance
$99,230
Interest Rate
3.12%
Estimated Equity
$998,934
Purchase Details
Closed on
Aug 23, 2005
Sold by
Wagner Richard G and Wagner Amy D
Bought by
Wagner Richard G and Wagner Amy D
Create a Home Valuation Report for This Property
The Home Valuation Report is an in-depth analysis detailing your home's value as well as a comparison with similar homes in the area
Home Values in the Area
Average Home Value in this Area
Purchase History
| Date | Buyer | Sale Price | Title Company |
|---|---|---|---|
| Bryan J Even Revocable Trust | -- | Rosenberg Pllc | |
| Even Bryan J | -- | Rosenberg Pllc | |
| Even Bryan J | $905,000 | A&N Title & Settlement | |
| Wagner Richard G | -- | None Available |
Source: Public Records
Mortgage History
| Date | Status | Borrower | Loan Amount |
|---|---|---|---|
| Open | Even Bryan J | $109,000 |
Source: Public Records
Tax History
| Year | Tax Paid | Tax Assessment Tax Assessment Total Assessment is a certain percentage of the fair market value that is determined by local assessors to be the total taxable value of land and additions on the property. | Land | Improvement |
|---|---|---|---|---|
| 2025 | $6,758 | $958,600 | $116,900 | $841,700 |
| 2024 | $6,566 | $958,600 | $116,900 | $841,700 |
| 2023 | $6,451 | $848,800 | $59,200 | $789,600 |
| 2022 | $6,451 | $848,800 | $59,200 | $789,600 |
| 2021 | $5,846 | $700,100 | $50,700 | $649,400 |
| 2020 | $5,846 | $700,100 | $50,700 | $649,400 |
| 2019 | $6,036 | $727,200 | $50,700 | $676,500 |
| 2018 | $6,036 | $727,200 | $50,700 | $676,500 |
| 2017 | $5,251 | $727,200 | $50,700 | $676,500 |
| 2016 | $5,251 | $632,600 | $52,400 | $580,200 |
| 2015 | -- | $632,600 | $52,400 | $580,200 |
| 2011 | -- | $1,090,500 | $233,000 | $857,500 |
Source: Public Records
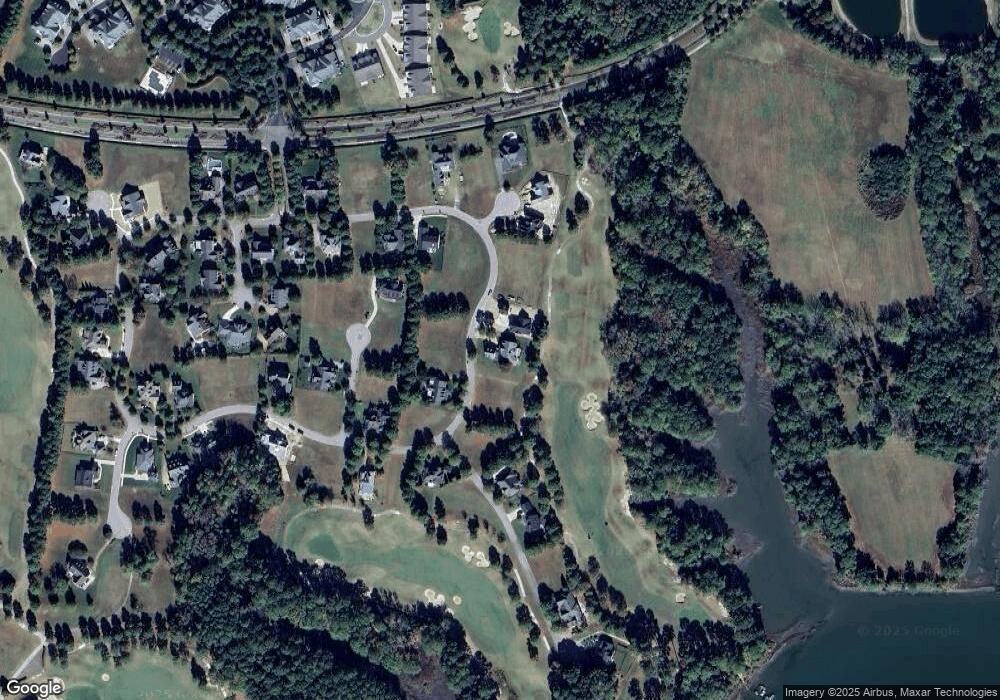
Map
Nearby Homes
- 4 Martz Ct
- 1 Martz Ct Unit 6
- 504 Arnie's Loop Unit 3
- 502 Arnie's Loop Unit 4
- 219 Palmer Dr
- 21A Palmer Dr
- 217 Palmer Dr
- 209 Palmer Dr
- 213 Palmer Dr
- 210 Old Course Loop
- 9 Deacon Ct
- 702 Prestwick Turn
- 708 Prestwick Turn
- 812 Turnberry Arch
- 815 Turnberry Arch
- 110 Creekside Ln Unit 12
- 305 Troon Ct
- 315 Troon Ct
- 116 Creekside Ln
- 116 Creekside Ln Unit 15
- 404 Arnie's Loop
- 406 Arnies Loop
- 406 Arnie's Loop Unit 13
- 406 Arnie's Loop
- 401 Arnie's Loop
- 401 Arnies Loop
- 3 Palmers Landing
- 3 Palmers Landing
- 3 Palmer's Landing
- 10 Seay Ct Unit 76
- 10 Seay Ct Unit 74
- 0 Martz Ct Unit 8 63486
- 2 Martz Ct Unit 11
- 1 Martz Ct
- 6 Martz Ct
- 2 Martz Ct
- 0 Martz Ct Unit 6
- Lot 9 Martz Ct Unit 9
- 2 Martz Ct Unit 10
- 2 Palmers Landing
Your Personal Tour Guide
Ask me questions while you tour the home.