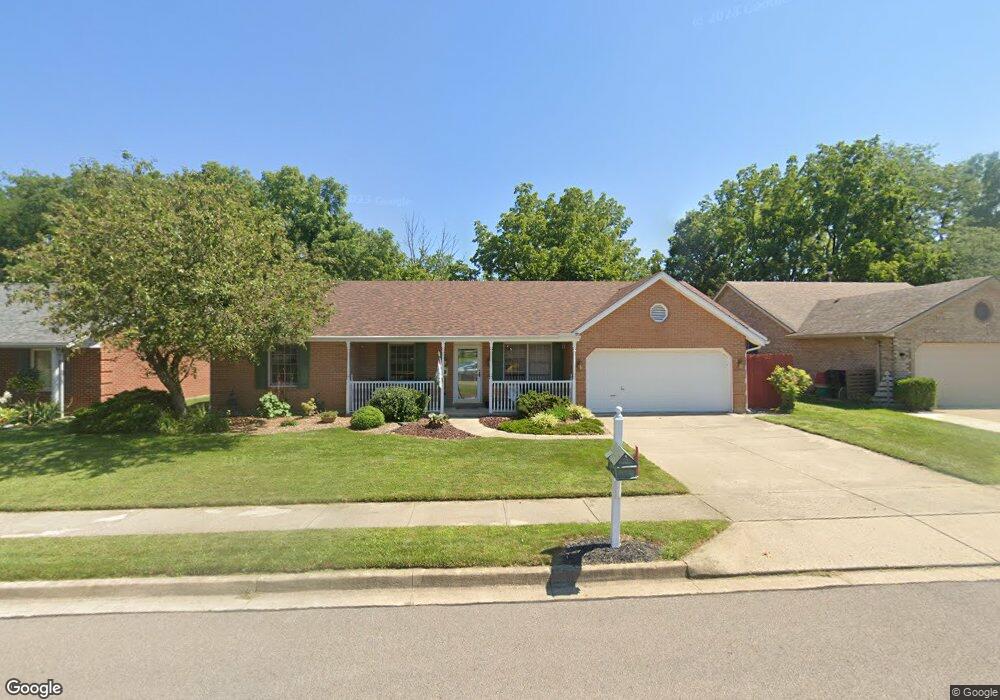
404 Booth Ave Wilmington, OH 45177
Estimated Value: $273,139 - $311,000
3
Beds
2
Baths
1,614
Sq Ft
$182/Sq Ft
Est. Value
About This Home
This home is located at 404 Booth Ave, Wilmington, OH 45177 and is currently estimated at $293,285, approximately $181 per square foot. 404 Booth Ave is a home located in Clinton County with nearby schools including East End Elementary School, Roy E. Holmes Elementary School, and Denver Place Elementary School.
Ownership History
Date
Name
Owned For
Owner Type
Purchase Details
Closed on
Jul 11, 2005
Sold by
Shenberger Georgia L
Bought by
Harvey Judy
Current Estimated Value
Home Financials for this Owner
Home Financials are based on the most recent Mortgage that was taken out on this home.
Original Mortgage
$112,500
Outstanding Balance
$58,467
Interest Rate
5.69%
Mortgage Type
Fannie Mae Freddie Mac
Estimated Equity
$234,818
Purchase Details
Closed on
Jun 17, 2005
Sold by
Shenberger Georgia L
Bought by
Harvey Judy
Home Financials for this Owner
Home Financials are based on the most recent Mortgage that was taken out on this home.
Original Mortgage
$112,500
Outstanding Balance
$58,467
Interest Rate
5.69%
Mortgage Type
Fannie Mae Freddie Mac
Estimated Equity
$234,818
Purchase Details
Closed on
May 20, 1993
Bought by
Shenberger Georgia L
Create a Home Valuation Report for This Property
The Home Valuation Report is an in-depth analysis detailing your home's value as well as a comparison with similar homes in the area
Home Values in the Area
Average Home Value in this Area
Purchase History
| Date | Buyer | Sale Price | Title Company |
|---|---|---|---|
| Harvey Judy | $142,500 | -- | |
| Harvey Judy | $142,500 | Titlequest Agency Inc | |
| Shenberger Georgia L | -- | -- |
Source: Public Records
Mortgage History
| Date | Status | Borrower | Loan Amount |
|---|---|---|---|
| Open | Harvey Judy | $112,500 |
Source: Public Records
Tax History Compared to Growth
Tax History
| Year | Tax Paid | Tax Assessment Tax Assessment Total Assessment is a certain percentage of the fair market value that is determined by local assessors to be the total taxable value of land and additions on the property. | Land | Improvement |
|---|---|---|---|---|
| 2024 | $2,054 | $70,780 | $8,090 | $62,690 |
| 2023 | $2,054 | $70,780 | $8,090 | $62,690 |
| 2022 | $2,013 | $56,420 | $7,350 | $49,070 |
| 2021 | $2,037 | $56,420 | $7,350 | $49,070 |
| 2020 | $1,915 | $56,420 | $7,350 | $49,070 |
| 2019 | $1,735 | $46,680 | $7,110 | $39,570 |
| 2018 | $1,751 | $46,680 | $7,110 | $39,570 |
| 2017 | $851 | $46,680 | $7,110 | $39,570 |
| 2016 | $1,375 | $37,260 | $6,980 | $30,280 |
| 2015 | $1,353 | $37,260 | $6,980 | $30,280 |
| 2013 | $1,426 | $38,830 | $6,980 | $31,850 |
Source: Public Records
Map
Nearby Homes
- 629 Oakridge Dr
- 1706 Woodside Dr
- 1244 Mayfair Dr
- 1247 Peggy Ln
- 1351 Mayfair Dr
- 585 Silverado Dr
- 588 John Chambers Dr
- 909 W Main St
- 987 N Nelson Ave
- 493 Mitchell Rd
- 2536 Wayne Rd
- 423 Howard St
- 1087 Warren Dr
- 373 Thorne Ave
- 166 Glenwood Cir
- 584 Howard St
- 360 Summit St
- 555 Cross Creek Dr
- 0 N Wood St
- 668 Catalpa Dr
- 392 Booth Ave
- 418 Booth Ave
- 378 Booth Ave
- 432 Booth Ave
- 110 Lookout Ct
- 115 Lookout Ct
- 425 Booth Ave
- 672 Oakridge Ave
- 364 Booth Ave
- 648 Oakridge Ave
- 353 Booth Ave
- 124 Lookout Ct
- 129 Lookout Ct
- 632 Oakridge Ave
- 350 Booth Ave
- 335 Booth Ave
- 620 Oakridge Ave
- 138 Lookout Ct
- 143 Lookout Ct
- 671 Oakridge Ave