Estimated Value: $278,000 - $373,000
3
Beds
1
Bath
1,316
Sq Ft
$241/Sq Ft
Est. Value
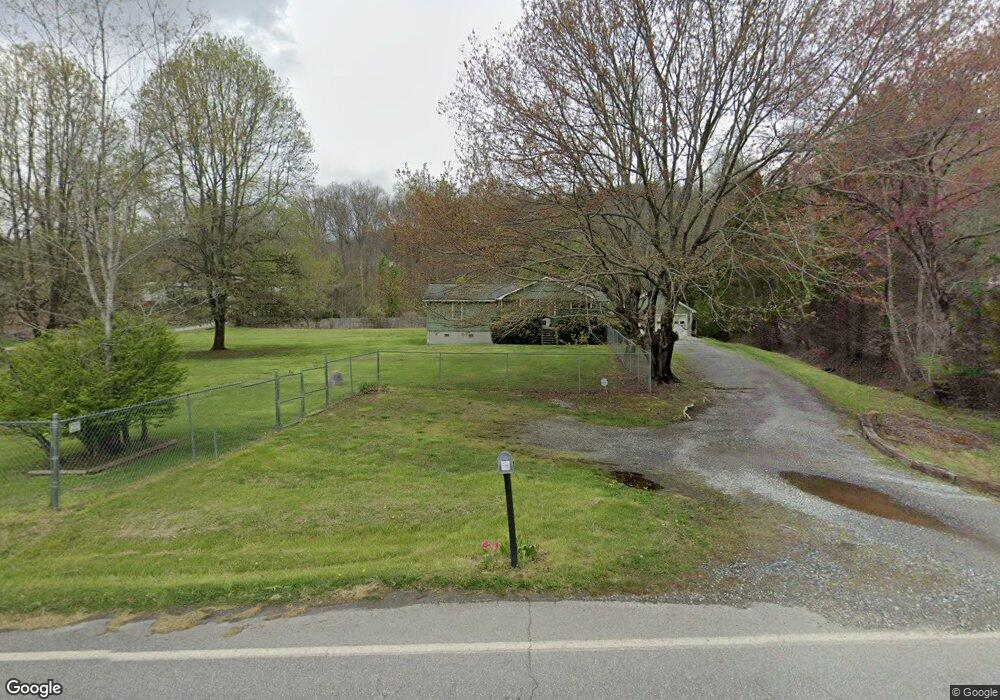
About This Home
This home is located at 404 Cabe Rd, Sylva, NC 28779 and is currently estimated at $317,033, approximately $240 per square foot. 404 Cabe Rd is a home located in Jackson County with nearby schools including Fairview Elementary School, Smoky Mountain High School, and Victory Christian School.
Ownership History
Date
Name
Owned For
Owner Type
Purchase Details
Closed on
Oct 19, 2020
Sold by
Fitzgerald Jane B and Fitzgerald Steven W
Bought by
Mathis Heather L
Current Estimated Value
Home Financials for this Owner
Home Financials are based on the most recent Mortgage that was taken out on this home.
Original Mortgage
$176,400
Outstanding Balance
$160,948
Interest Rate
4.44%
Mortgage Type
New Conventional
Estimated Equity
$156,085
Purchase Details
Closed on
May 30, 2008
Sold by
Watkins April C and Watkins James M
Bought by
Fitzgerald Steven W and Fitzgerald Jane B
Purchase Details
Closed on
Mar 16, 2005
Sold by
Buchanan Johnny W and Buchanan Elizabeth Jane
Bought by
Buchanan Johnny W
Create a Home Valuation Report for This Property
The Home Valuation Report is an in-depth analysis detailing your home's value as well as a comparison with similar homes in the area
Home Values in the Area
Average Home Value in this Area
Purchase History
| Date | Buyer | Sale Price | Title Company |
|---|---|---|---|
| Mathis Heather L | $196,000 | None Available | |
| Fitzgerald Steven W | $174,000 | -- | |
| Buchanan Johnny W | -- | -- |
Source: Public Records
Mortgage History
| Date | Status | Borrower | Loan Amount |
|---|---|---|---|
| Open | Mathis Heather L | $176,400 |
Source: Public Records
Tax History
| Year | Tax Paid | Tax Assessment Tax Assessment Total Assessment is a certain percentage of the fair market value that is determined by local assessors to be the total taxable value of land and additions on the property. | Land | Improvement |
|---|---|---|---|---|
| 2025 | $1,058 | $278,348 | $43,950 | $234,398 |
| 2024 | $747 | $196,470 | $26,370 | $170,100 |
| 2023 | $872 | $196,470 | $26,370 | $170,100 |
| 2022 | $872 | $196,470 | $26,370 | $170,100 |
| 2021 | $747 | $196,470 | $26,370 | $170,100 |
| 2020 | $655 | $150,210 | $27,280 | $122,930 |
| 2019 | $655 | $150,210 | $27,280 | $122,930 |
| 2018 | $655 | $150,210 | $27,280 | $122,930 |
| 2017 | $640 | $150,210 | $27,280 | $122,930 |
| 2015 | $553 | $150,210 | $27,280 | $122,930 |
| 2011 | -- | $132,180 | $33,950 | $98,230 |
Source: Public Records
Map
Nearby Homes
- 00 Tract B&C Us Highway 441 None S
- 27 Lacy Fern Ridge Unit 27
- 1200 N Star Ln
- 00 Tract B & C Us Hwy 441
- 24 Lacy Fern Ridge Unit 24
- 30 Lacy Fern Ridge Unit 30
- 25 Lacy Fern Ridge Unit 25
- 26 Lacy Fern Ridge Unit 26
- 31 Lacy Fern Ridge Unit 31
- 28 Lacy Fern Ridge Unit 28
- 29 Lacy Fern Ridge Unit 29
- 197 Savannah Meadows Trail
- 50 Timber Leaf Dr Unit 8
- 50 Timber Leaf Dr
- Lot 12 Timber Leaf Dr
- 0 E Rd
- 373 Fox Trace Dr
- 9 Timber Leaf Dr
- 0 Dove Rd Unit 19550950
- 538 E Fork Rd
Your Personal Tour Guide
Ask me questions while you tour the home.