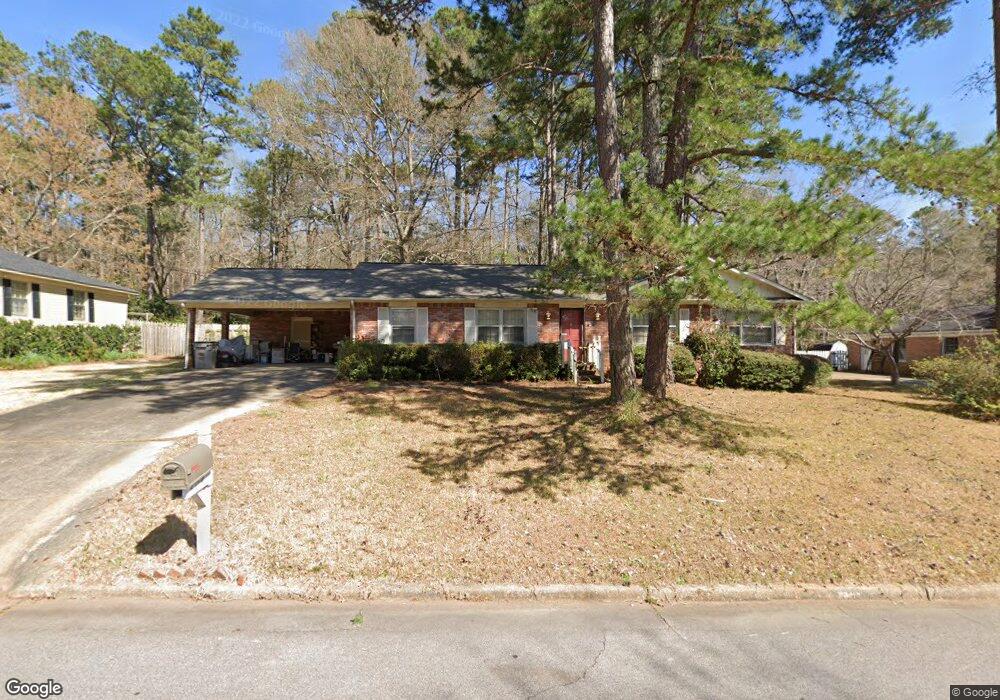
404 Camelot Dr Lagrange, GA 30241
Estimated Value: $221,029 - $262,000
4
Beds
2
Baths
1,644
Sq Ft
$145/Sq Ft
Est. Value
About This Home
This home is located at 404 Camelot Dr, Lagrange, GA 30241 and is currently estimated at $238,757, approximately $145 per square foot. 404 Camelot Dr is a home located in Troup County with nearby schools including Franklin Forest Elementary School, Hollis Hand Elementary School, and Ethel W. Kight Elementary School.
Ownership History
Date
Name
Owned For
Owner Type
Purchase Details
Closed on
Dec 19, 2025
Sold by
Blackwater Creek Holdings Llc
Bought by
Johnson Jerry
Current Estimated Value
Purchase Details
Closed on
Feb 3, 2006
Sold by
Parker James David
Bought by
Bailey John J and Bailey Patricia
Purchase Details
Closed on
Oct 30, 1998
Sold by
Lisa Mcneil Skelton Maluff
Bought by
James D Parker
Purchase Details
Closed on
Oct 25, 1993
Sold by
Carter Horace L
Bought by
Lisa Mcneil Skelton Maluff
Purchase Details
Closed on
Mar 1, 1990
Sold by
Cathy John and Cathy Pearce
Bought by
Carter Horace L
Purchase Details
Closed on
Jun 20, 1985
Sold by
Michael R Dellaripa
Bought by
Cathy John and Cathy Pearce
Purchase Details
Closed on
May 17, 1984
Sold by
Sherry Wm L and Sherry Tillery
Bought by
Michael R Dellaripa
Purchase Details
Closed on
May 15, 1975
Sold by
Lagrange Investment Co
Bought by
Sherry Wm L and Sherry Tillery
Create a Home Valuation Report for This Property
The Home Valuation Report is an in-depth analysis detailing your home's value as well as a comparison with similar homes in the area
Purchase History
| Date | Buyer | Sale Price | Title Company |
|---|---|---|---|
| Johnson Jerry | -- | -- | |
| Bailey John J | $133,500 | -- | |
| James D Parker | $98,500 | -- | |
| Lisa Mcneil Skelton Maluff | $84,200 | -- | |
| Carter Horace L | $74,000 | -- | |
| Cathy John | -- | -- | |
| Michael R Dellaripa | -- | -- | |
| Sherry Wm L | -- | -- |
Source: Public Records
Tax History
| Year | Tax Paid | Tax Assessment Tax Assessment Total Assessment is a certain percentage of the fair market value that is determined by local assessors to be the total taxable value of land and additions on the property. | Land | Improvement |
|---|---|---|---|---|
| 2025 | $2,132 | $78,172 | $10,000 | $68,172 |
| 2024 | $1,809 | $66,312 | $10,000 | $56,312 |
| 2023 | $1,646 | $60,364 | $10,000 | $50,364 |
| 2022 | $1,600 | $57,324 | $10,000 | $47,324 |
| 2021 | $1,403 | $46,504 | $8,000 | $38,504 |
| 2020 | $1,403 | $46,504 | $8,000 | $38,504 |
| 2019 | $1,377 | $45,648 | $8,000 | $37,648 |
| 2018 | $1,123 | $37,232 | $6,000 | $31,232 |
| 2017 | $1,123 | $37,232 | $6,000 | $31,232 |
| 2016 | $1,090 | $36,148 | $6,000 | $30,148 |
| 2015 | $1,038 | $34,376 | $6,360 | $28,016 |
| 2014 | $996 | $32,901 | $6,360 | $26,541 |
| 2013 | -- | $34,703 | $6,360 | $28,343 |
Source: Public Records
Map
Nearby Homes
- 203 Bonaventure Dr
- 224 Rutland Cir
- 210 Hearthstone Dr
- 102 Dogwood Dr
- 706 N Harlem Cir
- 202 Park Hill Dr
- 87 Youngs Mill Rd
- 616 S Harlem Cir
- 115 Clara Jean Ct
- 110 Lenox Cir
- 212 Cleveland Dr
- 204 Cleveland Dr
- 131 Foch St
- 114 Briarcliff Rd
- 806 New Franklin Rd
- 107 N Barnard Ave
- 0 N Barnard Ave
- 900 North St
- 110 Russell St
- 204 Colonial St
- 406 Camelot Dr
- 402 Camelot Dr
- 405 Camelot Dr
- 403 Camelot Dr
- 400 Camelot Dr
- 407 Camelot Dr
- 408 Camelot Dr
- 401 Camelot Dr
- 401 Camelot Dr Unit 50
- 409 Camelot Dr
- 410 Camelot Dr
- 500 Hickory Terrace
- 308 Valley Ct
- 470 Hickory Terrace
- 306 Valley Ct
- 411 Camelot Dr
- 310 Valley Ct
- 310 Valley Ct Unit 45
- 304 Valley Ct
- 412 Camelot Dr
Your Personal Tour Guide
Ask me questions while you tour the home.