404 Chilson Ave Lansing, MI 48906
Creston NeighborhoodEstimated Value: $95,000 - $113,539
2
Beds
1
Bath
782
Sq Ft
$135/Sq Ft
Est. Value
About This Home
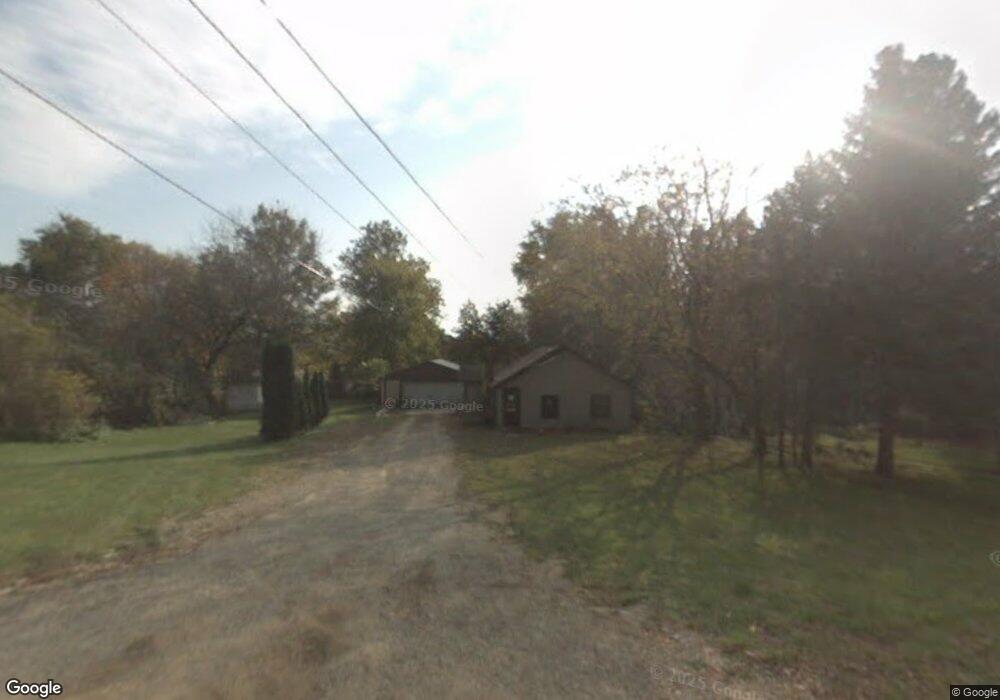
This home is located at 404 Chilson Ave, Lansing, MI 48906 and is currently estimated at $105,635, approximately $135 per square foot. 404 Chilson Ave is a home located in Ingham County with nearby schools including Gier Park School, Pattengill Academy, and Eastern High School.
Ownership History
Date
Name
Owned For
Owner Type
Purchase Details
Closed on
Feb 23, 2012
Sold by
Brothers N Christ Property Management In
Bought by
Kent Davina
Current Estimated Value
Purchase Details
Closed on
Sep 19, 2008
Sold by
Federal National Mortgage Association
Bought by
Brothers N Christ Property Management In
Purchase Details
Closed on
May 4, 2007
Sold by
Mortgage Electronic Registration Systems
Bought by
Federal National Mortgage Association
Purchase Details
Closed on
Apr 12, 2007
Sold by
Parish Frank N
Bought by
Mortgage Electronic Registration Systems
Purchase Details
Closed on
Aug 6, 2002
Sold by
First National Acceptance Company
Bought by
Parish Frank N
Purchase Details
Closed on
Aug 4, 2001
Sold by
Parish Frankle N and Parish Patricia M
Bought by
Ottaco Acceptance Inc
Purchase Details
Closed on
Nov 3, 2000
Sold by
Equifunding Inc
Bought by
Ottaco Acceptance Inc
Create a Home Valuation Report for This Property
The Home Valuation Report is an in-depth analysis detailing your home's value as well as a comparison with similar homes in the area
Home Values in the Area
Average Home Value in this Area
Purchase History
| Date | Buyer | Sale Price | Title Company |
|---|---|---|---|
| Kent Davina | -- | None Available | |
| Brothers N Christ Property Management In | $11,550 | Warranty Title Agency Llc | |
| Federal National Mortgage Association | -- | None Available | |
| Mortgage Electronic Registration Systems | $34,058 | None Available | |
| Parish Frank N | $26,000 | -- | |
| Ottaco Acceptance Inc | -- | -- | |
| Ottaco Acceptance Inc | -- | -- |
Source: Public Records
Tax History Compared to Growth
Tax History
| Year | Tax Paid | Tax Assessment Tax Assessment Total Assessment is a certain percentage of the fair market value that is determined by local assessors to be the total taxable value of land and additions on the property. | Land | Improvement |
|---|---|---|---|---|
| 2025 | $2,423 | $47,600 | $16,000 | $31,600 |
| 2024 | $19 | $44,200 | $16,000 | $28,200 |
| 2023 | $2,898 | $41,200 | $16,000 | $25,200 |
| 2022 | $2,051 | $37,800 | $14,400 | $23,400 |
| 2021 | $2,009 | $37,300 | $14,400 | $22,900 |
| 2020 | $2,071 | $35,000 | $14,400 | $20,600 |
| 2019 | $3,344 | $31,900 | $14,400 | $17,500 |
| 2018 | $1,794 | $30,200 | $14,400 | $15,800 |
| 2017 | $1,717 | $30,200 | $14,400 | $15,800 |
| 2016 | $2,976 | $29,900 | $14,400 | $15,500 |
| 2015 | $2,976 | $29,200 | $28,809 | $391 |
| 2014 | $2,976 | $28,800 | $0 | $0 |
Source: Public Records
Map
Nearby Homes
- 2508 Gary Ave
- 533 Community St
- 801 Banghart St
- 213 E Thomas St
- 816 Orchard Glen Ave
- 712 Sanford St
- 1919 N East St
- 2318 N High St
- 415 Filley St
- 310 W Frederick Ave
- 3425 Turner Rd
- 1016 Lake Lansing Rd
- 0 Lake Lansing Rd Unit 289258
- 1810 N High St
- 1017 Whyte St
- V/L (1036) N Larch St
- 109 Desander Dr Unit 109
- 152 Donald Ave Unit 152
- 627 W Frederick Ave
- 117 Desander Dr Unit 117