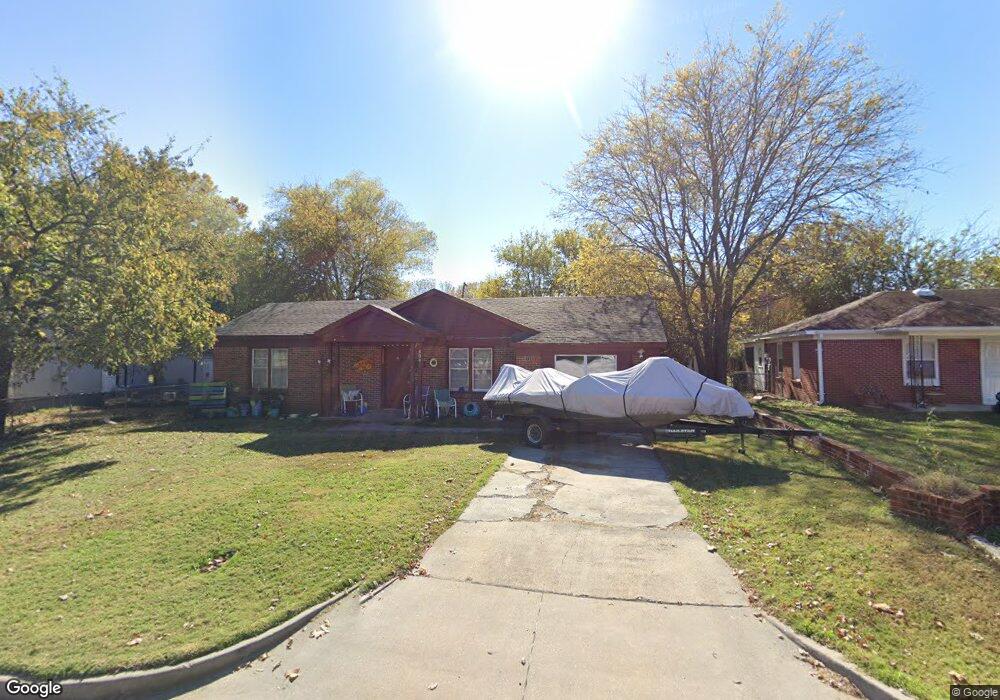
404 Cottonwood St Ardmore, OK 73401
Estimated Value: $92,000 - $128,000
3
Beds
2
Baths
1,142
Sq Ft
$96/Sq Ft
Est. Value
About This Home
This home is located at 404 Cottonwood St, Ardmore, OK 73401 and is currently estimated at $109,081, approximately $95 per square foot. 404 Cottonwood St is a home located in Carter County with nearby schools including Charles Evans Elementary School, Ardmore Middle School, and Ardmore High School.
Ownership History
Date
Name
Owned For
Owner Type
Purchase Details
Closed on
Feb 12, 2013
Sold by
Smithers Casey Dean and Smithers Kathy
Bought by
Cox Richard G and Cox Darla
Current Estimated Value
Home Financials for this Owner
Home Financials are based on the most recent Mortgage that was taken out on this home.
Original Mortgage
$41,495
Outstanding Balance
$28,763
Interest Rate
3.38%
Mortgage Type
Future Advance Clause Open End Mortgage
Estimated Equity
$80,318
Purchase Details
Closed on
Nov 15, 1996
Sold by
Roberts Betty J
Bought by
Smithers Casey D and Smithers Sh
Create a Home Valuation Report for This Property
The Home Valuation Report is an in-depth analysis detailing your home's value as well as a comparison with similar homes in the area
Home Values in the Area
Average Home Value in this Area
Purchase History
| Date | Buyer | Sale Price | Title Company |
|---|---|---|---|
| Cox Richard G | $40,000 | Stewart Abstract & Title Of | |
| Smithers Casey D | $31,000 | -- |
Source: Public Records
Mortgage History
| Date | Status | Borrower | Loan Amount |
|---|---|---|---|
| Open | Cox Richard G | $41,495 |
Source: Public Records
Tax History Compared to Growth
Tax History
| Year | Tax Paid | Tax Assessment Tax Assessment Total Assessment is a certain percentage of the fair market value that is determined by local assessors to be the total taxable value of land and additions on the property. | Land | Improvement |
|---|---|---|---|---|
| 2025 | $772 | $8,209 | $819 | $7,390 |
| 2024 | $772 | $7,819 | $780 | $7,039 |
| 2023 | $735 | $7,446 | $729 | $6,717 |
| 2022 | $678 | $7,092 | $685 | $6,407 |
| 2021 | $681 | $6,754 | $625 | $6,129 |
| 2020 | $640 | $6,432 | $528 | $5,904 |
| 2019 | $595 | $6,125 | $501 | $5,624 |
| 2018 | $576 | $5,834 | $477 | $5,357 |
| 2017 | $508 | $5,557 | $444 | $5,113 |
| 2016 | $493 | $5,291 | $589 | $4,702 |
| 2015 | $387 | $5,040 | $383 | $4,657 |
| 2014 | $369 | $4,801 | $365 | $4,436 |
Source: Public Records
Map
Nearby Homes
- 430 Locust St
- 434 Locust St NW
- 1817 Comanche St
- 1740 Tiverton St
- 1750 Mount Washington Rd
- 1714 Salisbury St
- 505 Campbell St
- 11 Turner St
- 703 Cottonwood St
- 210 15th Ave NW
- 412 Wandering Way
- 715 Ash St
- 800 Cottonwood St
- 0 15th Unit 2546881
- 723 Maxwell St NW
- 132 Veterans Blvd
- 520 Northwest Ave
- 722 Maxwell St NW
- 00 N Rockford Rd
- 1409 Mount Washington Rd